
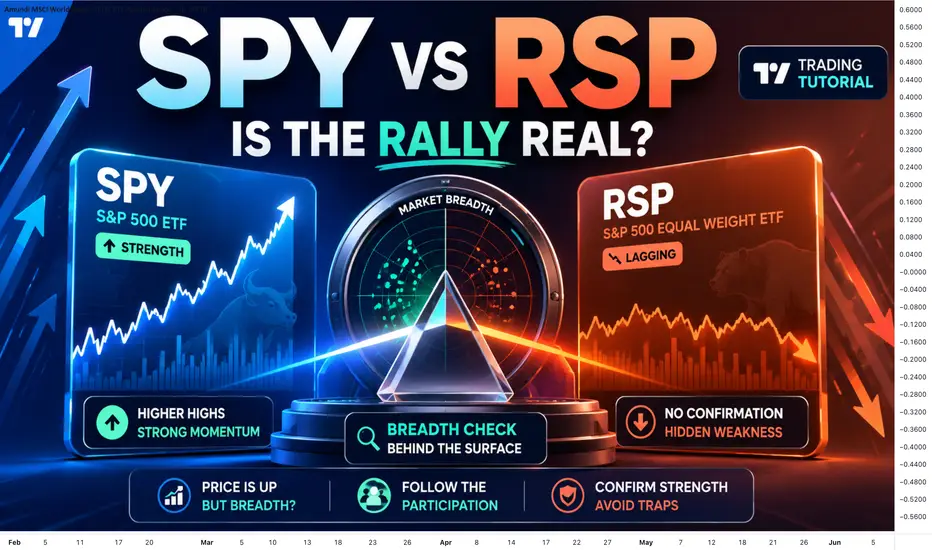
A market rally can look strong on the surface, but the real question is:
Is the whole market rising, or are only a few big stocks carrying the index?
This is where comparing SPY and RSP becomes useful.
SPY tracks the S&P 500 in a market-cap weighted way. That means the biggest companies have a larger effect on the index. If a few mega-cap stocks are performing well, SPY can move higher even if many other stocks are not doing much.
RSP tracks the S&P 500 with equal weight. That means every company has a more balanced impact. Because of this, RSP can give a clearer view of broad market participation.
Why this matters
If SPY is making new highs but RSP is lagging behind, it can be a warning sign.
It does not automatically mean the rally will fail, but it tells us that the rally may not be as broad as it looks. A strong market usually has participation from many stocks, not just a small group of leaders.
Simple way to read it
If SPY is rising and RSP is also rising, the rally has better confirmation.
If SPY is rising but RSP is flat or weak, the rally may be narrow.
If both SPY and RSP are weak, market strength is clearly missing.
How traders can use this
I do not use SPY vs RSP as a direct buy or sell signal.
I use it as a market health check.
Before chasing a rally, I want to know whether the move is supported by broad participation or only by a few large-cap names. This helps avoid buying into a move that looks strong but has weak support underneath.
Simple checklist:
1. Is SPY making higher highs?
2. Is RSP confirming the move?
3. Is RSP lagging or breaking down?
4. Are only mega-cap stocks leading?
5. Is the market showing broad participation?
6. Is the risk/reward still worth it?
The main lesson is simple:
Price can move higher, but breadth tells us how healthy the move is.
A strong rally usually needs more than a few big names. It needs participation.
Do you check market breadth before trading index moves, or do you only watch the main index chart?
Share your view below. This is one of those simple tools that can completely change how traders read the market.
Is the whole market rising, or are only a few big stocks carrying the index?
This is where comparing SPY and RSP becomes useful.
SPY tracks the S&P 500 in a market-cap weighted way. That means the biggest companies have a larger effect on the index. If a few mega-cap stocks are performing well, SPY can move higher even if many other stocks are not doing much.
RSP tracks the S&P 500 with equal weight. That means every company has a more balanced impact. Because of this, RSP can give a clearer view of broad market participation.
Why this matters
If SPY is making new highs but RSP is lagging behind, it can be a warning sign.
It does not automatically mean the rally will fail, but it tells us that the rally may not be as broad as it looks. A strong market usually has participation from many stocks, not just a small group of leaders.
Simple way to read it
If SPY is rising and RSP is also rising, the rally has better confirmation.
If SPY is rising but RSP is flat or weak, the rally may be narrow.
If both SPY and RSP are weak, market strength is clearly missing.
How traders can use this
I do not use SPY vs RSP as a direct buy or sell signal.
I use it as a market health check.
Before chasing a rally, I want to know whether the move is supported by broad participation or only by a few large-cap names. This helps avoid buying into a move that looks strong but has weak support underneath.
Simple checklist:
1. Is SPY making higher highs?
2. Is RSP confirming the move?
3. Is RSP lagging or breaking down?
4. Are only mega-cap stocks leading?
5. Is the market showing broad participation?
6. Is the risk/reward still worth it?
The main lesson is simple:
Price can move higher, but breadth tells us how healthy the move is.
A strong rally usually needs more than a few big names. It needs participation.
Do you check market breadth before trading index moves, or do you only watch the main index chart?
Share your view below. This is one of those simple tools that can completely change how traders read the market.

Powiązane publikacje
Wyłączenie odpowiedzialności
Informacje i publikacje nie stanowią i nie powinny być traktowane jako porady finansowe, inwestycyjne, tradingowe ani jakiekolwiek inne rekomendacje dostarczane lub zatwierdzone przez TradingView. Więcej informacji znajduje się w Warunkach użytkowania.
Powiązane publikacje
Wyłączenie odpowiedzialności
Informacje i publikacje nie stanowią i nie powinny być traktowane jako porady finansowe, inwestycyjne, tradingowe ani jakiekolwiek inne rekomendacje dostarczane lub zatwierdzone przez TradingView. Więcej informacji znajduje się w Warunkach użytkowania.