Amazon ( AMZN) Daily: Testing Institutional 200 EMA Floor – Waiting for Volume Confirmation to Trigger Fib Recovery
### 📦 Amazon.com, Inc. (AMZN) Daily Technical Analysis (Ref: AMZN_2026-06-24_09-10-41.png)
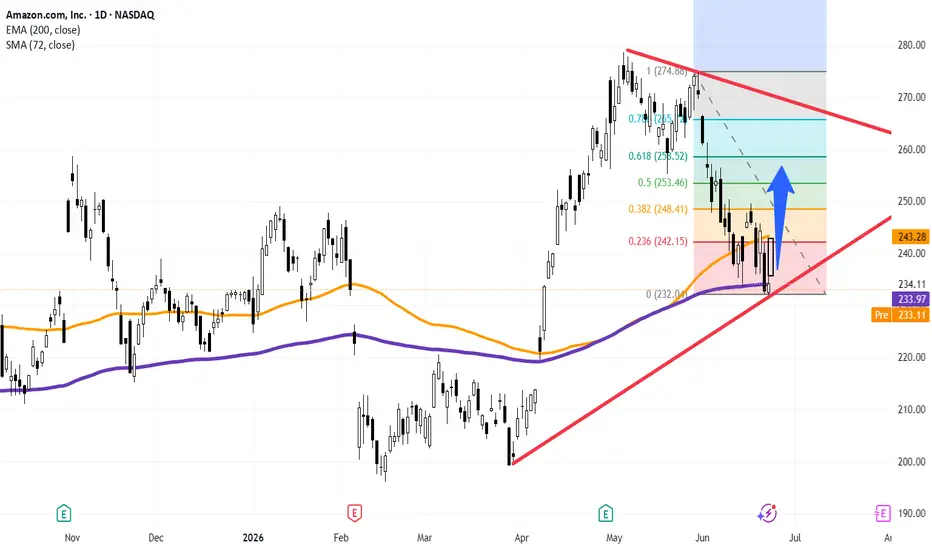
We are releasing a high-confluence structural update on Amazon.com, Inc. (AMZN - NASDAQ) on the Daily (1D) timeframe. The tech giant has completed a deep corrective phase and is currently sitting at a vital long-term institutional junction that could define its macro direction for the upcoming weeks.
The asset concluded its last session printing a tight stabilisation bar, up **+0.57% at 234.11**.
---
### 🔍 The Triple-Layer Support Cluster:
Price action has drifted directly into a heavy, multi-layered technical floor where aggressive institutional defending order blocks are historical present:
1. **The Institutional Line in the Sand:** The price is actively testing the heavy **200-period EMA (purple line at 233.97)**.
2. **Fibonacci Structural Base:** This dynamic average perfectly aligns with the absolute base (0.0% level) of our recent corrective Fibonacci grid anchoring at **232.04**.
3. **Macro Line of Trend (LTA):** Adding further validity to this cluster, the lower primary ascending trendline (the lower red diagonal line) intersects precisely at this exact node.
---
### 📊 Tactical Playbook: Waiting for Volume & Force Confirmation
While the structural architecture is highly asymmetric for a bullish reversal, our framework demands strict discipline before executing long positions:
* **The Validation Criteria:** We require a definitive **bullish expansion candle backed by above-average volume** during today's trading session (as modeled by our blueprint sketch and blue upward vector). A strong closing signature off the 200 EMA confirms institutional absorption.
* **The Fibonacci Projections:** Once the reversal bar is locked in, the dynamic target matrix shifts toward a structured mean-reversion recovery. The primary mathematical milestones to watch sit at the sequential overhead Fibonacci retracement levels:
* **Target 1:** The 0.236 Fib node at **242.15** (near the overhead 72 SMA at 243.28).
* **Target 2:** The 0.382 Fib node at **248.41**.
* **Target 3:** The 0.50 structural equilibrium node at **253.46**.
### Tactical Summary:
We maintain a high-priority watch onAMZN at the open. Chasing shorts directly into the 200 EMA, the LTA, and the 0 Fib floor yields an incredibly poor risk/reward ratio. We will patiently wait for the daily candle confirmation to trigger asymmetric long setups, keeping initial invalidation stops tightly defined just underneath the 232 structural low.
---
📊 **ChartPro Data**
*Big Tech Architecture, Institutional Moving Average Filters & Systematic Confluence Sourcing.*
⚠️ **Disclaimer:** For educational and informational purposes only. This active market study represents a personal trading framework and does not constitute financial or investment advice.
AMZN) Daily: Testing Institutional 200 EMA Floor – Waiting for Volume Confirmation to Trigger Fib Recovery### 📦 Amazon.com, Inc. (
AMZN) Daily Technical Analysis (Ref: AMZN_2026-06-24_09-10-41.png)We are releasing a high-confluence structural update on Amazon.com, Inc. (
AMZN - NASDAQ) on the Daily (1D) timeframe. The tech giant has completed a deep corrective phase and is currently sitting at a vital long-term institutional junction that could define its macro direction for the upcoming weeks.The asset concluded its last session printing a tight stabilisation bar, up **+0.57% at 234.11**.
---
### 🔍 The Triple-Layer Support Cluster:
Price action has drifted directly into a heavy, multi-layered technical floor where aggressive institutional defending order blocks are historical present:
1. **The Institutional Line in the Sand:** The price is actively testing the heavy **200-period EMA (purple line at 233.97)**.
2. **Fibonacci Structural Base:** This dynamic average perfectly aligns with the absolute base (0.0% level) of our recent corrective Fibonacci grid anchoring at **232.04**.
3. **Macro Line of Trend (LTA):** Adding further validity to this cluster, the lower primary ascending trendline (the lower red diagonal line) intersects precisely at this exact node.
---
### 📊 Tactical Playbook: Waiting for Volume & Force Confirmation
While the structural architecture is highly asymmetric for a bullish reversal, our framework demands strict discipline before executing long positions:
* **The Validation Criteria:** We require a definitive **bullish expansion candle backed by above-average volume** during today's trading session (as modeled by our blueprint sketch and blue upward vector). A strong closing signature off the 200 EMA confirms institutional absorption.
* **The Fibonacci Projections:** Once the reversal bar is locked in, the dynamic target matrix shifts toward a structured mean-reversion recovery. The primary mathematical milestones to watch sit at the sequential overhead Fibonacci retracement levels:
* **Target 1:** The 0.236 Fib node at **242.15** (near the overhead 72 SMA at 243.28).
* **Target 2:** The 0.382 Fib node at **248.41**.
* **Target 3:** The 0.50 structural equilibrium node at **253.46**.
### Tactical Summary:
We maintain a high-priority watch on
AMZN at the open. Chasing shorts directly into the 200 EMA, the LTA, and the 0 Fib floor yields an incredibly poor risk/reward ratio. We will patiently wait for the daily candle confirmation to trigger asymmetric long setups, keeping initial invalidation stops tightly defined just underneath the 232 structural low.---
📊 **ChartPro Data**
*Big Tech Architecture, Institutional Moving Average Filters & Systematic Confluence Sourcing.*
⚠️ **Disclaimer:** For educational and informational purposes only. This active market study represents a personal trading framework and does not constitute financial or investment advice.

Wyłączenie odpowiedzialności
Informacje i publikacje nie stanowią i nie powinny być traktowane jako porady finansowe, inwestycyjne, tradingowe ani jakiekolwiek inne rekomendacje dostarczane lub zatwierdzone przez TradingView. Więcej informacji znajduje się w Warunkach użytkowania.
Wyłączenie odpowiedzialności
Informacje i publikacje nie stanowią i nie powinny być traktowane jako porady finansowe, inwestycyjne, tradingowe ani jakiekolwiek inne rekomendacje dostarczane lub zatwierdzone przez TradingView. Więcej informacji znajduje się w Warunkach użytkowania.