
Today, we will speak about AMZN.
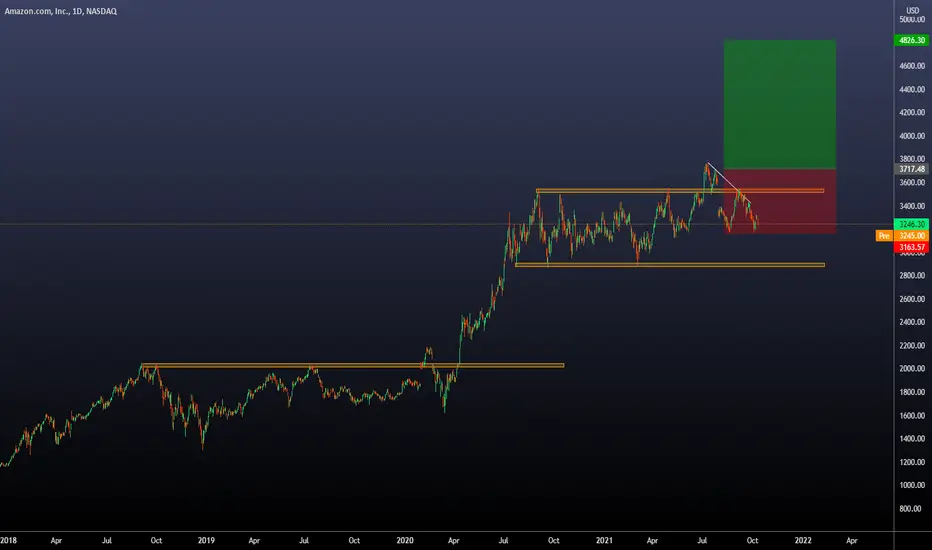
a) Currently, it is correcting the edge of the broken range.
b) We can see this type of behavior in the previous range from September 2018 until April 2020
c) To develop this setup, we asked this simple question: How many times can I prove that what I'm trying to trade right now has been proven as an effective system.

d) To answer that, we used the beautiful logarithmic chart to check ALL the situations since inception where the price has been consolidating for more than 300 days. What we can see is that this is a setup we must take based on past performance. Even if we have a stop loss, we will be executing the same setup again.
e) The parameters we are using on the setup are the ones you can see on the chart. The expected time for resolution of this may go between 170 to 250 days.
f) We will be risking 2% of our capital on a setup like this, aiming to make AT LEAST 4%.
g) We have seen in the past that once a trade like this is executed and the price starts going in our favor, it's smart to keep them open. That way, we can reach higher Risk to Reward Ratios.
Thanks for reading. If you have any doubts or want to share your view in the comments, feel free to do it. We read them all. Thanks.
a) Currently, it is correcting the edge of the broken range.
b) We can see this type of behavior in the previous range from September 2018 until April 2020
c) To develop this setup, we asked this simple question: How many times can I prove that what I'm trying to trade right now has been proven as an effective system.
d) To answer that, we used the beautiful logarithmic chart to check ALL the situations since inception where the price has been consolidating for more than 300 days. What we can see is that this is a setup we must take based on past performance. Even if we have a stop loss, we will be executing the same setup again.
e) The parameters we are using on the setup are the ones you can see on the chart. The expected time for resolution of this may go between 170 to 250 days.
f) We will be risking 2% of our capital on a setup like this, aiming to make AT LEAST 4%.
g) We have seen in the past that once a trade like this is executed and the price starts going in our favor, it's smart to keep them open. That way, we can reach higher Risk to Reward Ratios.
Thanks for reading. If you have any doubts or want to share your view in the comments, feel free to do it. We read them all. Thanks.

Wyłączenie odpowiedzialności
Informacje i publikacje nie stanowią i nie powinny być traktowane jako porady finansowe, inwestycyjne, tradingowe ani jakiekolwiek inne rekomendacje dostarczane lub zatwierdzone przez TradingView. Więcej informacji znajduje się w Warunkach użytkowania.
Wyłączenie odpowiedzialności
Informacje i publikacje nie stanowią i nie powinny być traktowane jako porady finansowe, inwestycyjne, tradingowe ani jakiekolwiek inne rekomendacje dostarczane lub zatwierdzone przez TradingView. Więcej informacji znajduje się w Warunkach użytkowania.