
Multi-Timeframe Analysis:
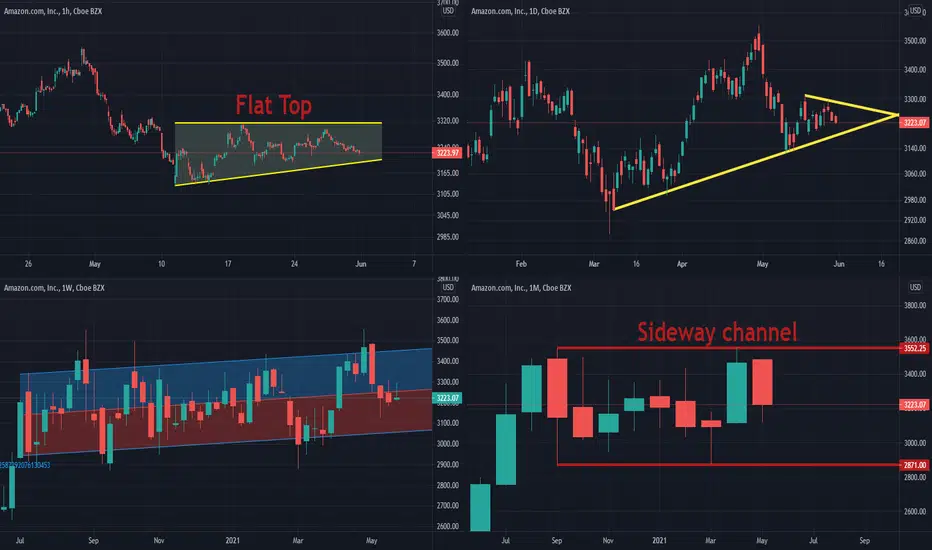
Hourly Chart: Flat Top (Neutral)
Daily Chart: Moving toward its support line. (Neutral- Bearish)
Weekly Chart: Doji at the middle of the regression channel (Neutral)
Monthly Chart: Pure sideway between 3550-2870 in the past 9 months. (Neutral)
Daily average trading value (YTD): Trading 37% below YTD (money outflow) ( Bearish )
Weekly average trading value: Trading36% below last trading year average. (money outflow) ( Bearish )
Monthly average trading value: Trading 15% below last trading year average. (money outflow) ( Bearish )
Conclusion: Neutral to Bearish in a sideway channel
Hourly Chart: Flat Top (Neutral)
Daily Chart: Moving toward its support line. (Neutral- Bearish)
Weekly Chart: Doji at the middle of the regression channel (Neutral)
Monthly Chart: Pure sideway between 3550-2870 in the past 9 months. (Neutral)
Daily average trading value (YTD): Trading 37% below YTD (money outflow) ( Bearish )
Weekly average trading value: Trading36% below last trading year average. (money outflow) ( Bearish )
Monthly average trading value: Trading 15% below last trading year average. (money outflow) ( Bearish )
Conclusion: Neutral to Bearish in a sideway channel

Use the following link to access trading ideas: patreon.com/SniperTraderStocks?utm_medium=unknown&utm_source=join_link&utm_campaign=creatorshare_creator&utm_content=copyLink
Wyłączenie odpowiedzialności
Informacje i publikacje nie stanowią i nie powinny być traktowane jako porady finansowe, inwestycyjne, tradingowe ani jakiekolwiek inne rekomendacje dostarczane lub zatwierdzone przez TradingView. Więcej informacji znajduje się w Warunkach użytkowania.
Use the following link to access trading ideas: patreon.com/SniperTraderStocks?utm_medium=unknown&utm_source=join_link&utm_campaign=creatorshare_creator&utm_content=copyLink
Wyłączenie odpowiedzialności
Informacje i publikacje nie stanowią i nie powinny być traktowane jako porady finansowe, inwestycyjne, tradingowe ani jakiekolwiek inne rekomendacje dostarczane lub zatwierdzone przez TradingView. Więcej informacji znajduje się w Warunkach użytkowania.