
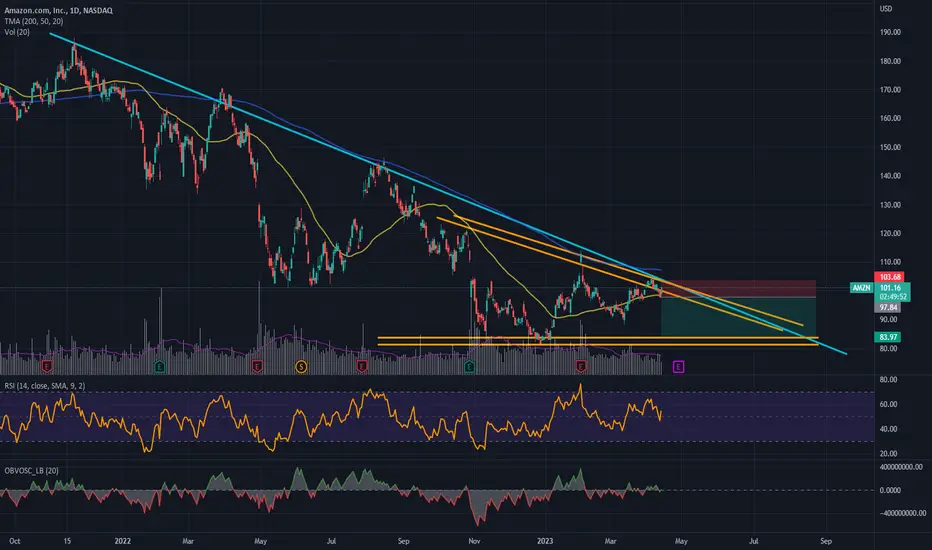
- Price below the 200 MA, confirming the general downtrend.
- Possible formation of descending triangle.
- Demand for the asset is weakening (see volume, RSI and OBV indicators).
When the price cuts below the 50 MA, the RSI is well below 50% and the OBV is red and well below the mid level, enter short. I prefer to enter my positions with confirmations of indicators, rather formations of patterns.
WARNING: THIS IS NOT A INVESTMENT ADVICE. I'M JUST POSTING MY IDEAS AND IT IS FOR EXCHANGE OPINIONS.

Wyłączenie odpowiedzialności
Informacje i publikacje nie stanowią i nie powinny być traktowane jako porady finansowe, inwestycyjne, tradingowe ani jakiekolwiek inne rekomendacje dostarczane lub zatwierdzone przez TradingView. Więcej informacji znajduje się w Warunkach użytkowania.
Wyłączenie odpowiedzialności
Informacje i publikacje nie stanowią i nie powinny być traktowane jako porady finansowe, inwestycyjne, tradingowe ani jakiekolwiek inne rekomendacje dostarczane lub zatwierdzone przez TradingView. Więcej informacji znajduje się w Warunkach użytkowania.