
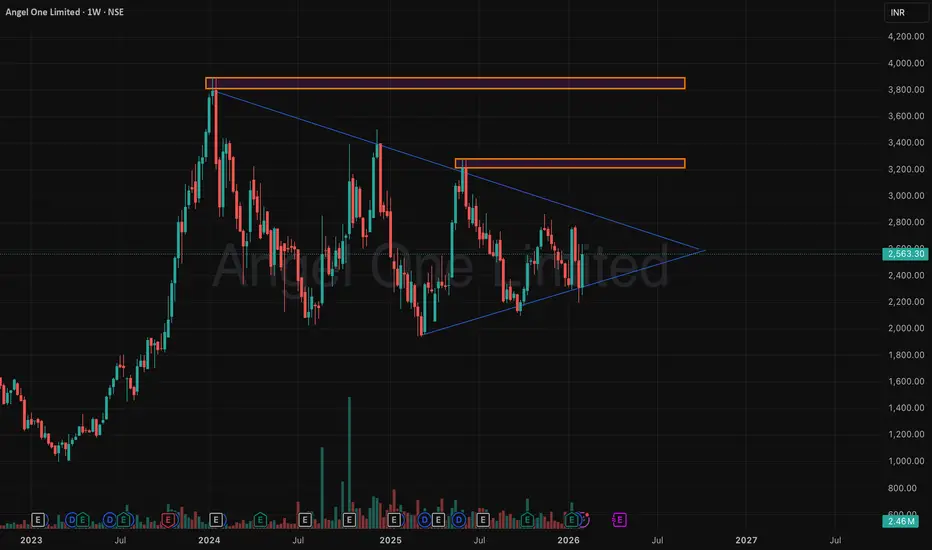
Angel One has transitioned from a strong impulsive uptrend into a prolonged consolidation and compression structure. Price is currently trading inside a symmetrical triangle, indicating balance between demand and supply after a volatile expansion phase.
This is a classic volatility contraction setup on a higher timeframe.
Trend & Market Structure:
The stock witnessed a sharp vertical rally followed by heavy profit booking.
Post the top, price has been forming lower highs and higher lows, converging into a symmetrical triangle.
This structure reflects institutional digestion, not weakness.
The broader trend remains structurally bullish, but momentum is paused.
Pattern Insight
Pattern: Symmetrical Triangle (Weekly)
Nature: Continuation / Expansion setup
Implication: Directional move expected once price exits the structure decisively
Compression on a weekly timeframe often leads to large directional moves.
Key Price Zones:
Major Supply Zone (Upper): ₹3,700 – ₹3,850
→ Strong historical rejection
→ Long-term supply / distribution area
Intermediate Supply: ₹3,200 – ₹3,300
→ Multiple failed attempts
→ Acts as a trend-deciding zone
Triangle Support: ~₹2,200 – ₹2,300
→ Buyers consistently defending this area
Current Equilibrium Price: ~₹2,550
→ Midpoint of the structure
→ Decision zone
Final View
Angel One is coiling on the weekly chart after a massive expansion.
Such structures usually resolve with force, but direction is decided by breakout, not bias.
📌 Compression = Energy storage
📌 Breakout = Direction
📌 Volume = Confirmation
Educational analysis only. Not a buy/sell recommendation.
This is a classic volatility contraction setup on a higher timeframe.
Trend & Market Structure:
The stock witnessed a sharp vertical rally followed by heavy profit booking.
Post the top, price has been forming lower highs and higher lows, converging into a symmetrical triangle.
This structure reflects institutional digestion, not weakness.
The broader trend remains structurally bullish, but momentum is paused.
Pattern Insight
Pattern: Symmetrical Triangle (Weekly)
Nature: Continuation / Expansion setup
Implication: Directional move expected once price exits the structure decisively
Compression on a weekly timeframe often leads to large directional moves.
Key Price Zones:
Major Supply Zone (Upper): ₹3,700 – ₹3,850
→ Strong historical rejection
→ Long-term supply / distribution area
Intermediate Supply: ₹3,200 – ₹3,300
→ Multiple failed attempts
→ Acts as a trend-deciding zone
Triangle Support: ~₹2,200 – ₹2,300
→ Buyers consistently defending this area
Current Equilibrium Price: ~₹2,550
→ Midpoint of the structure
→ Decision zone
Final View
Angel One is coiling on the weekly chart after a massive expansion.
Such structures usually resolve with force, but direction is decided by breakout, not bias.
📌 Compression = Energy storage
📌 Breakout = Direction
📌 Volume = Confirmation
Educational analysis only. Not a buy/sell recommendation.

Wyłączenie odpowiedzialności
Informacje i publikacje nie stanowią i nie powinny być traktowane jako porady finansowe, inwestycyjne, tradingowe ani jakiekolwiek inne rekomendacje dostarczane lub zatwierdzone przez TradingView. Więcej informacji znajduje się w Warunkach użytkowania.
Wyłączenie odpowiedzialności
Informacje i publikacje nie stanowią i nie powinny być traktowane jako porady finansowe, inwestycyjne, tradingowe ani jakiekolwiek inne rekomendacje dostarczane lub zatwierdzone przez TradingView. Więcej informacji znajduje się w Warunkach użytkowania.