
This is the daily chart, two signals:

1) Three green days and a break above EMA13.
2) A higher low: 25-Feb vs 3-Feb.
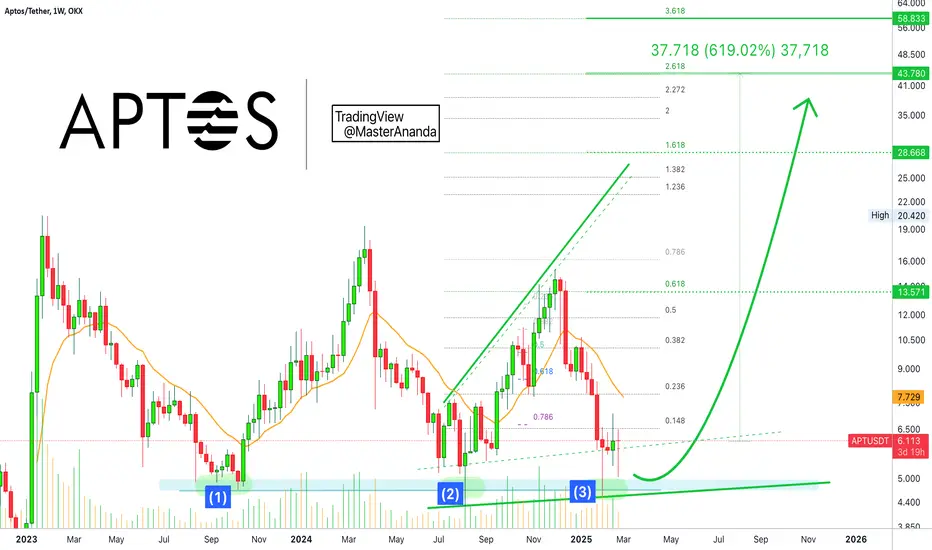
The weekly timeframe also shows a higher low but based on the long-term. February 2025 vs August 2024. There is also a triple-bottom when we consider the low set in October 2023 and count these last two lows as reaching the same level.
This week, in early February and in August 2024, in all instances, APTUSDT produced a long lower wick on the session. This means that buyers were ready and buyers bought. Prices dropped but the close happened close to the session open. After these candles, there was never a retest of the lower levels. Something very similar can be happening today.
The theme is now looking for proof that supports the end of the correction, the start of a new bullish wave. So far I shared the same signal repeated throughout many charts.
Aptos has great potential for long-term growth. In this chart setup, it is hard not to go LONG.
The correction is over. The next major move will be up. All sellers are being bought.
Do not sell now. Right now is the best time to buy and hold.
Either buy or if you already bought, just hold.
Namaste.
1) Three green days and a break above EMA13.
2) A higher low: 25-Feb vs 3-Feb.
The weekly timeframe also shows a higher low but based on the long-term. February 2025 vs August 2024. There is also a triple-bottom when we consider the low set in October 2023 and count these last two lows as reaching the same level.
This week, in early February and in August 2024, in all instances, APTUSDT produced a long lower wick on the session. This means that buyers were ready and buyers bought. Prices dropped but the close happened close to the session open. After these candles, there was never a retest of the lower levels. Something very similar can be happening today.
The theme is now looking for proof that supports the end of the correction, the start of a new bullish wave. So far I shared the same signal repeated throughout many charts.
Aptos has great potential for long-term growth. In this chart setup, it is hard not to go LONG.
The correction is over. The next major move will be up. All sellers are being bought.
Do not sell now. Right now is the best time to buy and hold.
Either buy or if you already bought, just hold.
Namaste.

Trading Cryptocurrencies can be the hardest undertaking ever without the right trade-numbers, without accurate private-access information. Free is free, but the best always requires sweat, an investment. Since 2017 👇
t.me/masteranandatrades/8778
t.me/masteranandatrades/8778
Powiązane publikacje
Wyłączenie odpowiedzialności
Informacje i publikacje nie stanowią i nie powinny być traktowane jako porady finansowe, inwestycyjne, tradingowe ani jakiekolwiek inne rekomendacje dostarczane lub zatwierdzone przez TradingView. Więcej informacji znajduje się w Warunkach użytkowania.
Trading Cryptocurrencies can be the hardest undertaking ever without the right trade-numbers, without accurate private-access information. Free is free, but the best always requires sweat, an investment. Since 2017 👇
t.me/masteranandatrades/8778
t.me/masteranandatrades/8778
Powiązane publikacje
Wyłączenie odpowiedzialności
Informacje i publikacje nie stanowią i nie powinny być traktowane jako porady finansowe, inwestycyjne, tradingowe ani jakiekolwiek inne rekomendacje dostarczane lub zatwierdzone przez TradingView. Więcej informacji znajduje się w Warunkach użytkowania.