
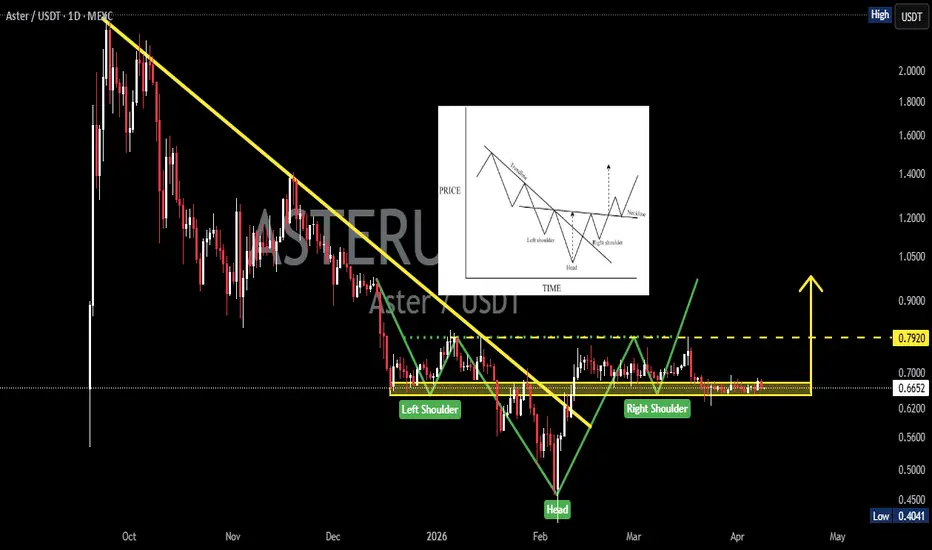
On the 1D timeframe, ASTER/USDT shows a transition from a prolonged downtrend (marked by the descending yellow trendline) into a phase of accumulation and potential reversal.
The primary pattern forming is:
🔹 Inverse Head and Shoulders (IH&S) – Bullish Reversal Pattern
Left Shoulder: Formed when price weakens but still holds initial support
Head: Deeper drop to around 0.40 (significant low)
Right Shoulder: Higher low indicating growing buyer strength
Neckline: Resistance area around 0.79
➡️ This pattern suggests a potential trend reversal from bearish to bullish, but still requires breakout confirmation.
---
🟨 Key Zone (Demand Area)
Yellow zone: 0.677 – 0.647
Acts as a strong support / demand zone
Price is currently moving sideways and consolidating within this area → indicating accumulation
➡️ As long as price holds this zone, the bias remains bullish accumulation
---
📉 Trendline Resistance
The descending yellow line represents the previous downtrend
A preliminary breakout has occurred, but without strong momentum
This indicates the market is still in a transition phase
---
🚀 Bullish Scenario
Main confirmation: Breakout above neckline (0.79)
If price:
Breaks and closes above 0.79
Supported by increasing volume
➡️ The IH&S pattern becomes valid
Potential targets:
Short term: 0.90
Mid term: 1.00 – 1.10
📌 Ideal setup:
Buy on breakout or neckline retest
Stop loss below 0.64
---
⚠️ Bearish Scenario
If price:
Fails to hold the 0.677 – 0.647 zone
Breaks down with strong bearish candles
➡️ Then:
The IH&S structure is invalidated
Price may resume the bearish trend
Downside targets:
0.60
0.55
Even a retest of 0.40 (previous low)
📌 This indicates weak demand against selling pressure
---
📌 Conclusion
The market is currently in a decision phase
The yellow zone is the key level to watch
IH&S provides a bullish signal, but not confirmed until neckline breakout
➡️ Current stance: WAIT & SEE + watch reaction at key levels
#ASTERUSDT #CryptoAnalysis #TechnicalAnalysis #InverseHeadAndShoulders #BullishReversal #SupportResistance #CryptoTrading #Altcoins #TradingViewIdeas #PriceAction #BreakoutSetup #CryptoSignals
The primary pattern forming is:
🔹 Inverse Head and Shoulders (IH&S) – Bullish Reversal Pattern
Left Shoulder: Formed when price weakens but still holds initial support
Head: Deeper drop to around 0.40 (significant low)
Right Shoulder: Higher low indicating growing buyer strength
Neckline: Resistance area around 0.79
➡️ This pattern suggests a potential trend reversal from bearish to bullish, but still requires breakout confirmation.
---
🟨 Key Zone (Demand Area)
Yellow zone: 0.677 – 0.647
Acts as a strong support / demand zone
Price is currently moving sideways and consolidating within this area → indicating accumulation
➡️ As long as price holds this zone, the bias remains bullish accumulation
---
📉 Trendline Resistance
The descending yellow line represents the previous downtrend
A preliminary breakout has occurred, but without strong momentum
This indicates the market is still in a transition phase
---
🚀 Bullish Scenario
Main confirmation: Breakout above neckline (0.79)
If price:
Breaks and closes above 0.79
Supported by increasing volume
➡️ The IH&S pattern becomes valid
Potential targets:
Short term: 0.90
Mid term: 1.00 – 1.10
📌 Ideal setup:
Buy on breakout or neckline retest
Stop loss below 0.64
---
⚠️ Bearish Scenario
If price:
Fails to hold the 0.677 – 0.647 zone
Breaks down with strong bearish candles
➡️ Then:
The IH&S structure is invalidated
Price may resume the bearish trend
Downside targets:
0.60
0.55
Even a retest of 0.40 (previous low)
📌 This indicates weak demand against selling pressure
---
📌 Conclusion
The market is currently in a decision phase
The yellow zone is the key level to watch
IH&S provides a bullish signal, but not confirmed until neckline breakout
➡️ Current stance: WAIT & SEE + watch reaction at key levels
#ASTERUSDT #CryptoAnalysis #TechnicalAnalysis #InverseHeadAndShoulders #BullishReversal #SupportResistance #CryptoTrading #Altcoins #TradingViewIdeas #PriceAction #BreakoutSetup #CryptoSignals

✅ Get Free Signals! Join Our Telegram Channel Here: t.me/TheCryptoNuclear
✅ Twitter: twitter.com/crypto_nuclear
✅ Join Bybit : partner.bybit.com/b/nuclearvip
✅ Benefits : Lifetime Trading Fee Discount -50%
✅ Twitter: twitter.com/crypto_nuclear
✅ Join Bybit : partner.bybit.com/b/nuclearvip
✅ Benefits : Lifetime Trading Fee Discount -50%
Wyłączenie odpowiedzialności
Informacje i publikacje nie stanowią i nie powinny być traktowane jako porady finansowe, inwestycyjne, tradingowe ani jakiekolwiek inne rekomendacje dostarczane lub zatwierdzone przez TradingView. Więcej informacji znajduje się w Warunkach użytkowania.
✅ Get Free Signals! Join Our Telegram Channel Here: t.me/TheCryptoNuclear
✅ Twitter: twitter.com/crypto_nuclear
✅ Join Bybit : partner.bybit.com/b/nuclearvip
✅ Benefits : Lifetime Trading Fee Discount -50%
✅ Twitter: twitter.com/crypto_nuclear
✅ Join Bybit : partner.bybit.com/b/nuclearvip
✅ Benefits : Lifetime Trading Fee Discount -50%
Wyłączenie odpowiedzialności
Informacje i publikacje nie stanowią i nie powinny być traktowane jako porady finansowe, inwestycyjne, tradingowe ani jakiekolwiek inne rekomendacje dostarczane lub zatwierdzone przez TradingView. Więcej informacji znajduje się w Warunkach użytkowania.