
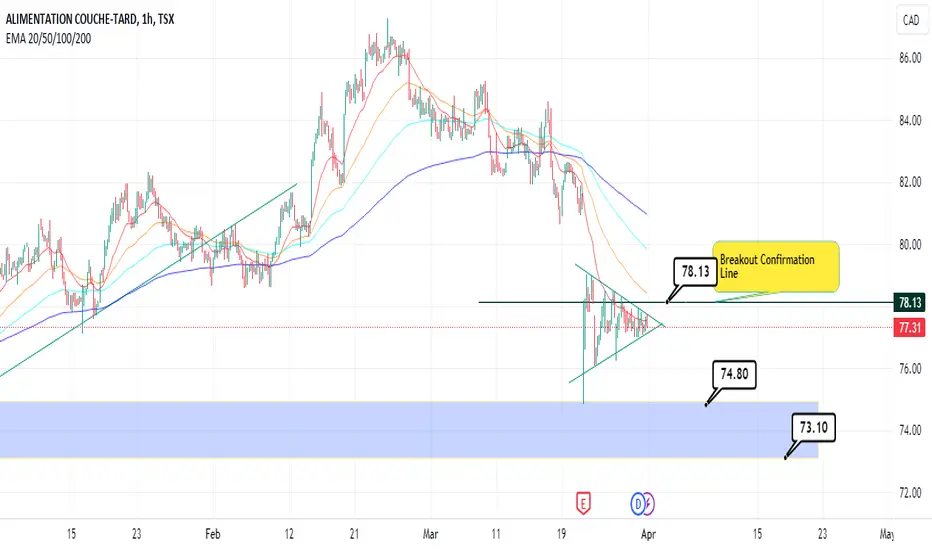
There’s a clear symmetric triangle nearing a breakout and it can go any side as this pattern typically indicates a period of consolidation, with the price breakout direction being uncertain.
In case of a bearish breakout, there’s a strong support zone between $74 and $73. I’d suggest you to wait until the price breaks out above the red EMA 20 line on this hourly chart.
In case of a bearish breakout, there’s a strong support zone between $74 and $73. I’d suggest you to wait until the price breaks out above the red EMA 20 line on this hourly chart.

Wyłączenie odpowiedzialności
Informacje i publikacje nie stanowią i nie powinny być traktowane jako porady finansowe, inwestycyjne, tradingowe ani jakiekolwiek inne rekomendacje dostarczane lub zatwierdzone przez TradingView. Więcej informacji znajduje się w Warunkach użytkowania.
Wyłączenie odpowiedzialności
Informacje i publikacje nie stanowią i nie powinny być traktowane jako porady finansowe, inwestycyjne, tradingowe ani jakiekolwiek inne rekomendacje dostarczane lub zatwierdzone przez TradingView. Więcej informacji znajduje się w Warunkach użytkowania.