

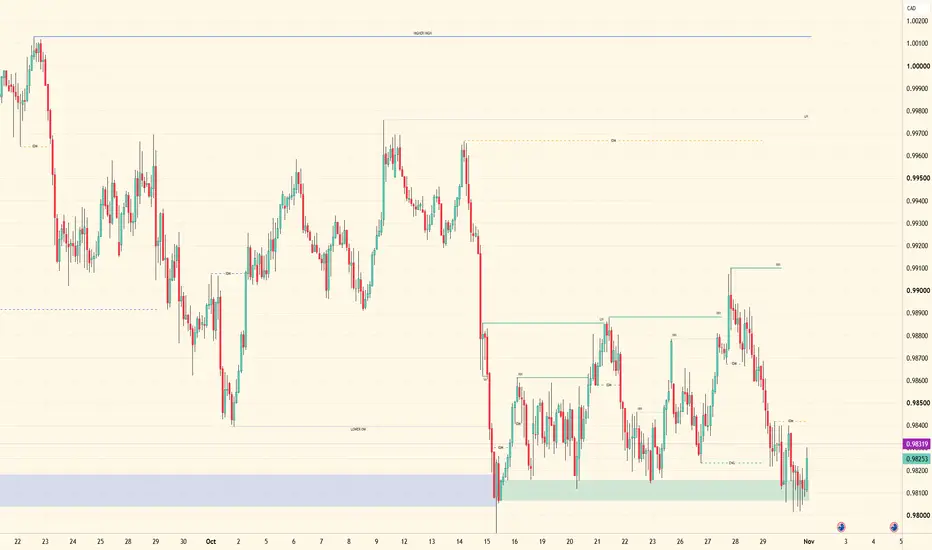
Locking in the liquidity gives me a clearer perspective on where price may be drawn next.
Currently tracking the midterm inducement, marked by the orange dotted line above current price action. This liquidity sits above the lower-timeframe external auction zone marked in green.
Price has been holding that lower-timeframe auction zone as support while liquidity remains overhead. That gives me interest in a potential bullish delivery toward the midterm inducement.
However, location and liquidity alone aren't enough for execution. I'm waiting for lower-timeframe structure to continue developing and for bullish momentum to align before considering a long position.
The objective is mapped. Now it's about watching how price responds and allowing the footprints to confirm the next move.
Patience is key. Tracking remains the edge.

Wyłączenie odpowiedzialności
Informacje i publikacje nie stanowią i nie powinny być traktowane jako porady finansowe, inwestycyjne, tradingowe ani jakiekolwiek inne rekomendacje dostarczane lub zatwierdzone przez TradingView. Więcej informacji znajduje się w Warunkach użytkowania.
Wyłączenie odpowiedzialności
Informacje i publikacje nie stanowią i nie powinny być traktowane jako porady finansowe, inwestycyjne, tradingowe ani jakiekolwiek inne rekomendacje dostarczane lub zatwierdzone przez TradingView. Więcej informacji znajduje się w Warunkach użytkowania.