

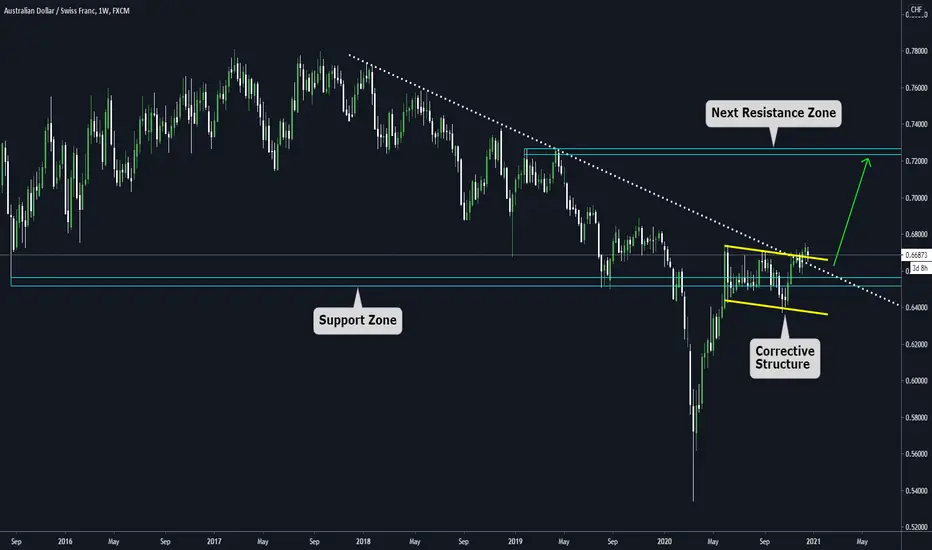
Let's take a look at the weekly chart on AUDCHF.
We have 3 relevant items to pay attention to
a) Broken descending trendline.
b) The price above a Huge support zone.
c) A massive Flag pattern on the edge of the broken descending trendline.
From a technical perspective, a Flag pattern is considered a continuation structure, which means that we have a sideways movement during a period of time, only for the price to keep going in the previous direction after the breakout.
We have 3 relevant items to pay attention to
a) Broken descending trendline.
b) The price above a Huge support zone.
c) A massive Flag pattern on the edge of the broken descending trendline.
From a technical perspective, a Flag pattern is considered a continuation structure, which means that we have a sideways movement during a period of time, only for the price to keep going in the previous direction after the breakout.

Wyłączenie odpowiedzialności
Informacje i publikacje nie stanowią i nie powinny być traktowane jako porady finansowe, inwestycyjne, tradingowe ani jakiekolwiek inne rekomendacje dostarczane lub zatwierdzone przez TradingView. Więcej informacji znajduje się w Warunkach użytkowania.
Wyłączenie odpowiedzialności
Informacje i publikacje nie stanowią i nie powinny być traktowane jako porady finansowe, inwestycyjne, tradingowe ani jakiekolwiek inne rekomendacje dostarczane lub zatwierdzone przez TradingView. Więcej informacji znajduje się w Warunkach użytkowania.