

Hi traders,
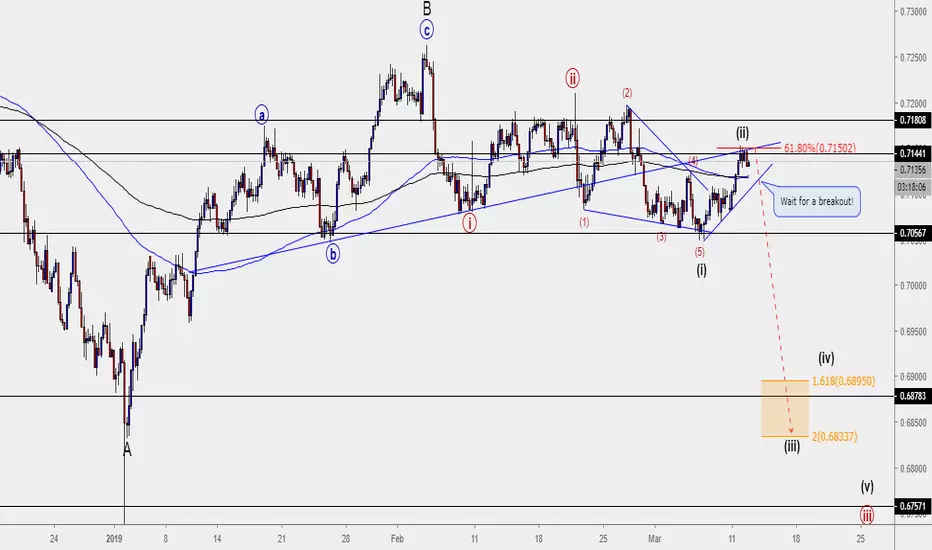
The 4-hour chart of AUDCHF shows that the breakout and retest of the Head & Shoulder pattern neckline is a complete 5-3 wave cycle.
.
The breakout shows a leading diagonal pattern in wave (i) and a zigzag pattern in wave (ii).
.
Considering that the corrective structure is completed and price also retested the broken neckline that lined up with resistance level and 61.8 Fib ratio, a bearish continuation is expected in wave (iii).
.
We will wait for the break out of the blue CTL to confirm the sell setup.
.
Best of luck on the chart!
Veejahbee.
The 4-hour chart of AUDCHF shows that the breakout and retest of the Head & Shoulder pattern neckline is a complete 5-3 wave cycle.
.
The breakout shows a leading diagonal pattern in wave (i) and a zigzag pattern in wave (ii).
.
Considering that the corrective structure is completed and price also retested the broken neckline that lined up with resistance level and 61.8 Fib ratio, a bearish continuation is expected in wave (iii).
.
We will wait for the break out of the blue CTL to confirm the sell setup.
.
Best of luck on the chart!
Veejahbee.

Wyłączenie odpowiedzialności
Informacje i publikacje nie stanowią i nie powinny być traktowane jako porady finansowe, inwestycyjne, tradingowe ani jakiekolwiek inne rekomendacje dostarczane lub zatwierdzone przez TradingView. Więcej informacji znajduje się w Warunkach użytkowania.
Wyłączenie odpowiedzialności
Informacje i publikacje nie stanowią i nie powinny być traktowane jako porady finansowe, inwestycyjne, tradingowe ani jakiekolwiek inne rekomendacje dostarczane lub zatwierdzone przez TradingView. Więcej informacji znajduje się w Warunkach użytkowania.