

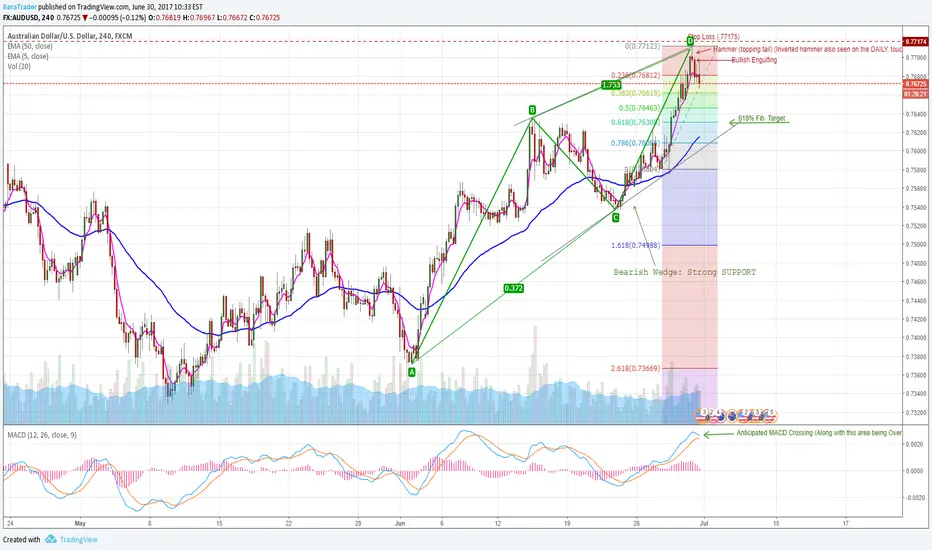
H4 Chart Technical Analysis: Short
Candlestick analysis of a bullish real body followed by an inverted hammer/topping tail, to a bearish engulfing (of the bullish).
Alongside this we have the MACD's anticipated crossing over and Overbought RSI at the time of the inverted hammer.
My target is not necessarily to 'touch' the bullish trend line of support, but to retrace to the .618% fib. as a correction.
All of this contained within a bearish ABCD pattern.
Thanks Guys,
Kera
Candlestick analysis of a bullish real body followed by an inverted hammer/topping tail, to a bearish engulfing (of the bullish).
Alongside this we have the MACD's anticipated crossing over and Overbought RSI at the time of the inverted hammer.
My target is not necessarily to 'touch' the bullish trend line of support, but to retrace to the .618% fib. as a correction.
All of this contained within a bearish ABCD pattern.
Thanks Guys,
Kera

Wyłączenie odpowiedzialności
Informacje i publikacje nie stanowią i nie powinny być traktowane jako porady finansowe, inwestycyjne, tradingowe ani jakiekolwiek inne rekomendacje dostarczane lub zatwierdzone przez TradingView. Więcej informacji znajduje się w Warunkach użytkowania.
Wyłączenie odpowiedzialności
Informacje i publikacje nie stanowią i nie powinny być traktowane jako porady finansowe, inwestycyjne, tradingowe ani jakiekolwiek inne rekomendacje dostarczane lub zatwierdzone przez TradingView. Więcej informacji znajduje się w Warunkach użytkowania.