

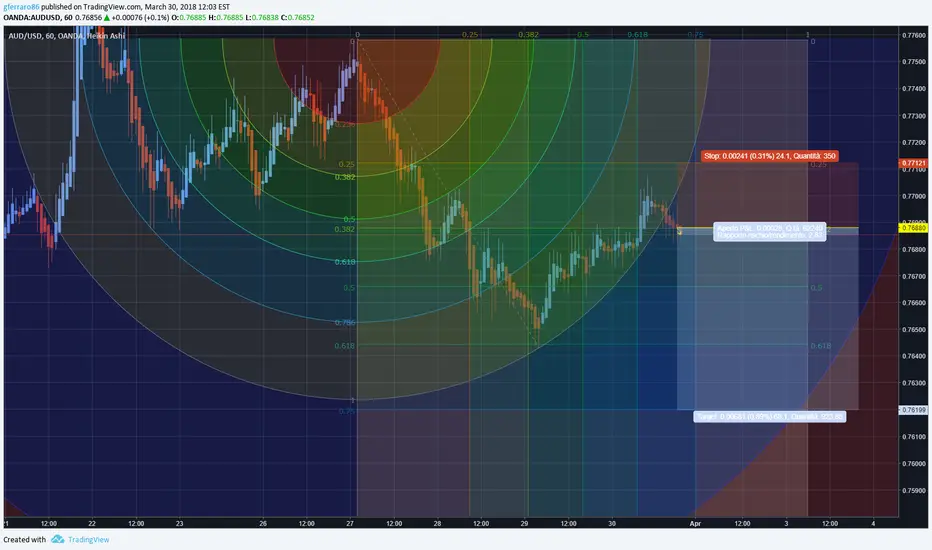
AUDUSD short
Uwaga
The idea is really easy and completely based on math. The audusd graph is actually a downtrend. I used the Fibonacci half circle to identify interesting price levels where the price has moved in the near past and where it's still reacting now. As soon as the price, after jumping up and down inside the tunnel, broken down again I opened a sell position. I also used the gann square to identify my target points and my stop loss. Really basic reference points. You can Easley find all the interesting points onthe graph I've shared
Wyłączenie odpowiedzialności
Informacje i publikacje nie stanowią i nie powinny być traktowane jako porady finansowe, inwestycyjne, tradingowe ani jakiekolwiek inne rekomendacje dostarczane lub zatwierdzone przez TradingView. Więcej informacji znajduje się w Warunkach użytkowania.
Wyłączenie odpowiedzialności
Informacje i publikacje nie stanowią i nie powinny być traktowane jako porady finansowe, inwestycyjne, tradingowe ani jakiekolwiek inne rekomendacje dostarczane lub zatwierdzone przez TradingView. Więcej informacji znajduje się w Warunkach użytkowania.