
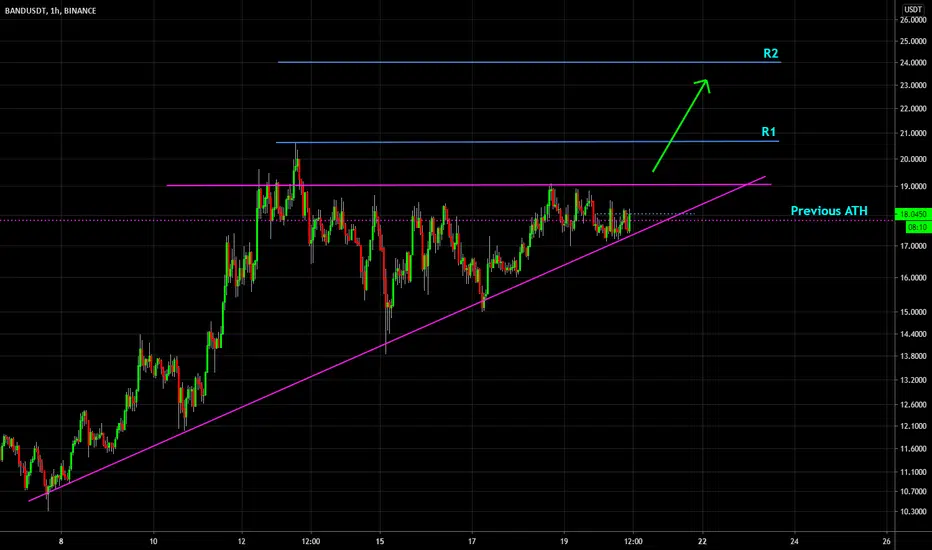
BAND has seen a period of consolidation after (marginally) bettering the previous all time high around $18. Since then, it has seen some bullish price action with higher highs and higher lows. At this point, a bullish triangle is unfolding.
Before entering this trade, wait till the price has closed above the top resistance of the triangle. Higher time frames provide more indicative power.
On the chart I’ve marked two potential areas of resistance, R1 and R2. These areas are based on recent swing highs and round numbers. Do your own due diligence.
Happy trading!
Before entering this trade, wait till the price has closed above the top resistance of the triangle. Higher time frames provide more indicative power.
On the chart I’ve marked two potential areas of resistance, R1 and R2. These areas are based on recent swing highs and round numbers. Do your own due diligence.
Happy trading!

🎯Official Channel: t.me/FieryTradingChannel
📈Try my Premium Signals for FREE - 80% Win-Rate: t.me/FT_Futures_free
✅Monster Signals: t.me/monster_cryptosignals
🔥Premium Signals: fierytrading.com
📈Try my Premium Signals for FREE - 80% Win-Rate: t.me/FT_Futures_free
✅Monster Signals: t.me/monster_cryptosignals
🔥Premium Signals: fierytrading.com
Powiązane publikacje
Wyłączenie odpowiedzialności
Informacje i publikacje nie stanowią i nie powinny być traktowane jako porady finansowe, inwestycyjne, tradingowe ani jakiekolwiek inne rekomendacje dostarczane lub zatwierdzone przez TradingView. Więcej informacji znajduje się w Warunkach użytkowania.
🎯Official Channel: t.me/FieryTradingChannel
📈Try my Premium Signals for FREE - 80% Win-Rate: t.me/FT_Futures_free
✅Monster Signals: t.me/monster_cryptosignals
🔥Premium Signals: fierytrading.com
📈Try my Premium Signals for FREE - 80% Win-Rate: t.me/FT_Futures_free
✅Monster Signals: t.me/monster_cryptosignals
🔥Premium Signals: fierytrading.com
Powiązane publikacje
Wyłączenie odpowiedzialności
Informacje i publikacje nie stanowią i nie powinny być traktowane jako porady finansowe, inwestycyjne, tradingowe ani jakiekolwiek inne rekomendacje dostarczane lub zatwierdzone przez TradingView. Więcej informacji znajduje się w Warunkach użytkowania.