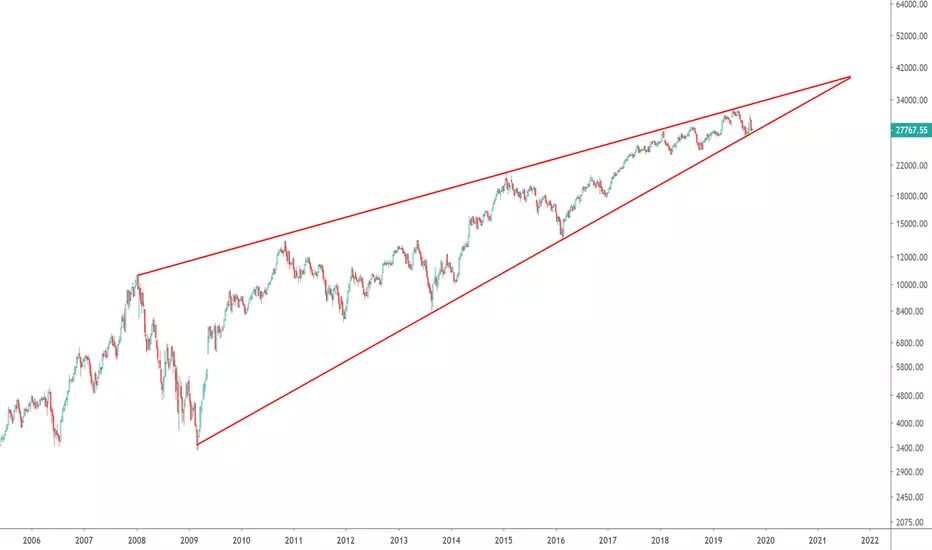
This rising wedge of  BANKNIFTY in LOG scale starts from 2008 and is active even today on October of 2019. The scale of this chart pattern is now more than 10 years which is massive in terms of time and this can only increase the significance of the chart pattern. As you can see from the chart the bottom support line has never been broken on a closing basis. I am not forecasting any trade here, but the break of this wedge to the bottom will definitely not support the current bullishness in the Indian market after the Corporate tax cuts.
I will update this if and once we break any of the two lines.
Follow us on Twitter
BANKNIFTY in LOG scale starts from 2008 and is active even today on October of 2019. The scale of this chart pattern is now more than 10 years which is massive in terms of time and this can only increase the significance of the chart pattern. As you can see from the chart the bottom support line has never been broken on a closing basis. I am not forecasting any trade here, but the break of this wedge to the bottom will definitely not support the current bullishness in the Indian market after the Corporate tax cuts. I will update this if and once we break any of the two lines.
Follow us on Twitter
Zlecenie aktywne
Bottom line is still acting as support.
Ideas for educational purposes only.
Wyłączenie odpowiedzialności
Informacje i publikacje nie stanowią i nie powinny być traktowane jako porady finansowe, inwestycyjne, tradingowe ani jakiekolwiek inne rekomendacje dostarczane lub zatwierdzone przez TradingView. Więcej informacji znajduje się w Warunkach użytkowania.
Ideas for educational purposes only.
Wyłączenie odpowiedzialności
Informacje i publikacje nie stanowią i nie powinny być traktowane jako porady finansowe, inwestycyjne, tradingowe ani jakiekolwiek inne rekomendacje dostarczane lub zatwierdzone przez TradingView. Więcej informacji znajduje się w Warunkach użytkowania.