
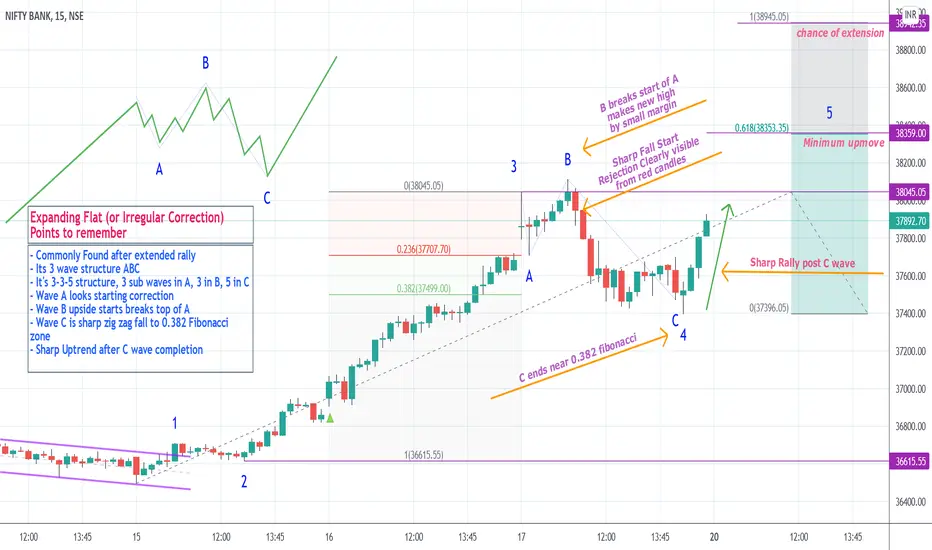
Most common found pattern. Its temporary pause to extended rally.
Key to identify this pattern is rejection after breaking wave A start.
Always look for very smaller margin rise above start of wave A.
C wave is sharp fall to reach 0.382 Fibonacci retracement of rally.
All other details explained in chart. Comment your doubts.
Key to identify this pattern is rejection after breaking wave A start.
Always look for very smaller margin rise above start of wave A.
C wave is sharp fall to reach 0.382 Fibonacci retracement of rally.
All other details explained in chart. Comment your doubts.

Powiązane publikacje
Wyłączenie odpowiedzialności
Informacje i publikacje nie stanowią i nie powinny być traktowane jako porady finansowe, inwestycyjne, tradingowe ani jakiekolwiek inne rekomendacje dostarczane lub zatwierdzone przez TradingView. Więcej informacji znajduje się w Warunkach użytkowania.
Powiązane publikacje
Wyłączenie odpowiedzialności
Informacje i publikacje nie stanowią i nie powinny być traktowane jako porady finansowe, inwestycyjne, tradingowe ani jakiekolwiek inne rekomendacje dostarczane lub zatwierdzone przez TradingView. Więcej informacji znajduje się w Warunkach użytkowania.