
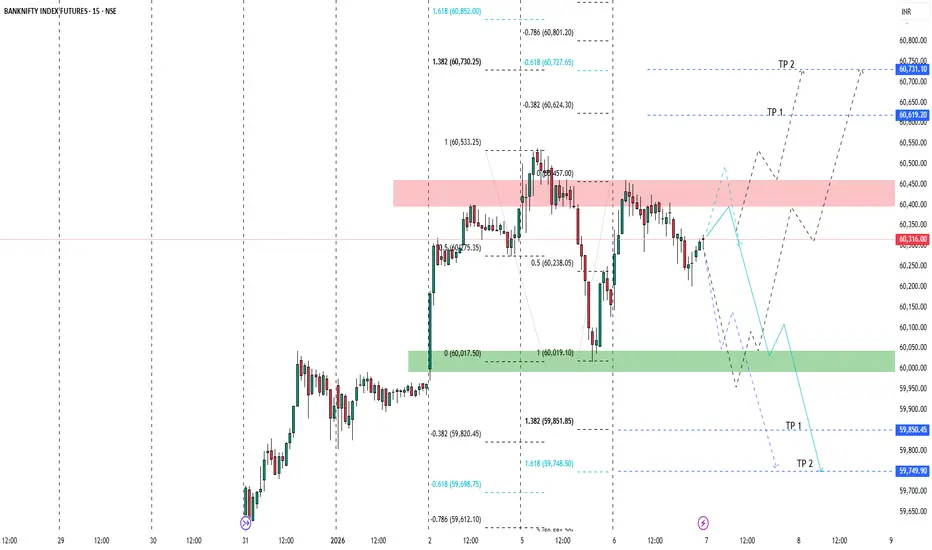
🔎 Market Structure
Overall range-bound with volatility
Price is currently inside a supply–demand battle zone
No clean trend yet → wait for confirmation
🔴 Supply / Resistance Zone (Important)
60,400 – 60,470 (red shaded area)
Strong selling pressure
Multiple rejections → sellers active
This is a make-or-break zone
👉 If price fails here → downside likely
👉 If price breaks & holds above → upside expansion
🟢 Demand / Support Zone
59,980 – 60,050 (green shaded area)
Strong buying interest
Previous bounce originated here
Acts as major intraday support
📈 Fibonacci Insights
Upside Fib Targets
0.618 → 60,727
1.0 → 60,730
1.618 → 60,852
Downside Fib Targets
1.0 → 59,851
1.618 → 59,748
These align well with your marked TP1 & TP2 levels 👍
🔮 Possible Scenarios
🟢 Bullish Scenario
Sustained close above 60,450
Volume expansion
Then targets:
🎯 TP1: 60,620
🎯 TP2: 60,730–60,850
📌 Best trades only after retest & hold
🔴 Bearish Scenario
Rejection from supply zone
Breakdown below 60,250
Targets:
🎯 TP1: 59,850
🎯 TP2: 59,750
📌 High probability if momentum increases on breakdown
⚠️ Trading Advice (Very Important)
Avoid middle-range trades
Let price come to zones
Trade only:
Break & retest
OR clear rejection candles (engulfing / strong wick)
Overall range-bound with volatility
Price is currently inside a supply–demand battle zone
No clean trend yet → wait for confirmation
🔴 Supply / Resistance Zone (Important)
60,400 – 60,470 (red shaded area)
Strong selling pressure
Multiple rejections → sellers active
This is a make-or-break zone
👉 If price fails here → downside likely
👉 If price breaks & holds above → upside expansion
🟢 Demand / Support Zone
59,980 – 60,050 (green shaded area)
Strong buying interest
Previous bounce originated here
Acts as major intraday support
📈 Fibonacci Insights
Upside Fib Targets
0.618 → 60,727
1.0 → 60,730
1.618 → 60,852
Downside Fib Targets
1.0 → 59,851
1.618 → 59,748
These align well with your marked TP1 & TP2 levels 👍
🔮 Possible Scenarios
🟢 Bullish Scenario
Sustained close above 60,450
Volume expansion
Then targets:
🎯 TP1: 60,620
🎯 TP2: 60,730–60,850
📌 Best trades only after retest & hold
🔴 Bearish Scenario
Rejection from supply zone
Breakdown below 60,250
Targets:
🎯 TP1: 59,850
🎯 TP2: 59,750
📌 High probability if momentum increases on breakdown
⚠️ Trading Advice (Very Important)
Avoid middle-range trades
Let price come to zones
Trade only:
Break & retest
OR clear rejection candles (engulfing / strong wick)
Transakcja zamknięta: osiągnięto wyznaczony cel

Wyłączenie odpowiedzialności
Informacje i publikacje nie stanowią i nie powinny być traktowane jako porady finansowe, inwestycyjne, tradingowe ani jakiekolwiek inne rekomendacje dostarczane lub zatwierdzone przez TradingView. Więcej informacji znajduje się w Warunkach użytkowania.
Wyłączenie odpowiedzialności
Informacje i publikacje nie stanowią i nie powinny być traktowane jako porady finansowe, inwestycyjne, tradingowe ani jakiekolwiek inne rekomendacje dostarczane lub zatwierdzone przez TradingView. Więcej informacji znajduje się w Warunkach użytkowania.