
🔎 Overview
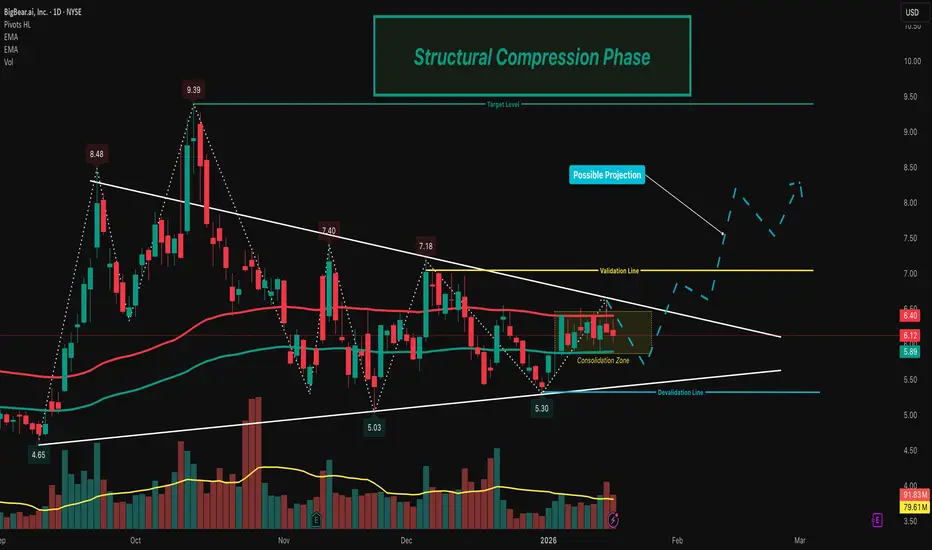
This idea focuses on identifying potential bullish expansion after a multi-day price consolidation inside the EMA 100 High–Low Band.
The structure highlights range compression, swing-based trendline pressure, and rising volume during consolidation, which together can signal a market preparing for directional movement rather than random noise.
────────────────────────────
📘 Core Components
EMA 100 High–Low Band
• The EMA 100 High–Low Band represents fair value and balance.
• Price consolidating inside this band suggests indecision and energy buildup, not trend weakness.
Pivot High–Low Swings
• Pivot Highs and Pivot Lows are used to map internal market structure.
• Two swing-based trendlines are drawn:
• One connecting lower highs
• One connecting higher lows
This creates a structure squeeze within value.
────────────────────────────
🛠 Market Structure Concept
Consolidation & Compression
• Price has remained inside the EMA High–Low Band for multiple sessions.
• Swing highs are compressing downward while swing lows are compressing upward.
• This reflects decreasing volatility and controlled price action, often seen before expansion.
────────────────────────────
📐 Trendline Structure
• Upper trendline connects progressively lower swing highs.
• Lower trendline connects progressively higher swing lows.
• Both trendlines converge, indicating structural pressure.
This is not direction — it is preparation.
────────────────────────────
📊 Volume Behavior
• Volume is above average while price remains in consolidation.
• Rising participation without range expansion suggests absorption, not exhaustion.
• This behavior often precedes directional acceptance, not immediate rejection.
────────────────────────────
📈 Bullish Expansion Context (Structure-Based)
• A clean acceptance above the upper swing trendline
• Followed by price sustaining above recent structure highs
• While remaining supported outside the EMA High–Low Band
This sequence would indicate resolution of compression rather than a false breakout.
────────────────────────────
🧭 Validation, Devalidation & Projection Framework
Validation Line (Strength Confirmation)
• A candle close above the validation line confirms structural acceptance.
• This signals that the compression phase has resolved with strength, not noise.
Devalidation Line (Structure Failure)
• A candle close below the devalidation line invalidates the setup.
• This indicates failure of compression logic and negates the structural thesis.
Target Line (Maximum Structural Projection)
• Once validated, the target line represents the maximum expected structural expansion based on current compression range.
• This is a projection reference, not a prediction.
Devalidation as Protection
• After validation, the Devalidation level acts as a structure protection zone.
• A sustained close below this level signals loss of acceptance and invalidates continuation logic.
────────────────────────────
📝 Summary
• EMA 100 High–Low Band defines balance and value.
• Price consolidates inside the band for multiple sessions.
• Swing-based trendlines show structural compression.
• Volume expands during consolidation, indicating participation.
• Validation and devalidation lines define acceptance and failure zones.
• Target and revalidation levels provide structured projection and protection.
• The idea focuses on structure resolution, not prediction.
• Direction is assessed only after acceptance, not anticipation.
────────────────────────────
⚠️ Disclaimer
📘 For educational purposes only.
🙅 Not SEBI registered.
❌ Not a buy/sell recommendation.
🧠 Purely a learning resource.
📊 Not Financial Advice.
This idea focuses on identifying potential bullish expansion after a multi-day price consolidation inside the EMA 100 High–Low Band.
The structure highlights range compression, swing-based trendline pressure, and rising volume during consolidation, which together can signal a market preparing for directional movement rather than random noise.
────────────────────────────
📘 Core Components
EMA 100 High–Low Band
• The EMA 100 High–Low Band represents fair value and balance.
• Price consolidating inside this band suggests indecision and energy buildup, not trend weakness.
Pivot High–Low Swings
• Pivot Highs and Pivot Lows are used to map internal market structure.
• Two swing-based trendlines are drawn:
• One connecting lower highs
• One connecting higher lows
This creates a structure squeeze within value.
────────────────────────────
🛠 Market Structure Concept
Consolidation & Compression
• Price has remained inside the EMA High–Low Band for multiple sessions.
• Swing highs are compressing downward while swing lows are compressing upward.
• This reflects decreasing volatility and controlled price action, often seen before expansion.
────────────────────────────
📐 Trendline Structure
• Upper trendline connects progressively lower swing highs.
• Lower trendline connects progressively higher swing lows.
• Both trendlines converge, indicating structural pressure.
This is not direction — it is preparation.
────────────────────────────
📊 Volume Behavior
• Volume is above average while price remains in consolidation.
• Rising participation without range expansion suggests absorption, not exhaustion.
• This behavior often precedes directional acceptance, not immediate rejection.
────────────────────────────
📈 Bullish Expansion Context (Structure-Based)
• A clean acceptance above the upper swing trendline
• Followed by price sustaining above recent structure highs
• While remaining supported outside the EMA High–Low Band
This sequence would indicate resolution of compression rather than a false breakout.
────────────────────────────
🧭 Validation, Devalidation & Projection Framework
Validation Line (Strength Confirmation)
• A candle close above the validation line confirms structural acceptance.
• This signals that the compression phase has resolved with strength, not noise.
Devalidation Line (Structure Failure)
• A candle close below the devalidation line invalidates the setup.
• This indicates failure of compression logic and negates the structural thesis.
Target Line (Maximum Structural Projection)
• Once validated, the target line represents the maximum expected structural expansion based on current compression range.
• This is a projection reference, not a prediction.
Devalidation as Protection
• After validation, the Devalidation level acts as a structure protection zone.
• A sustained close below this level signals loss of acceptance and invalidates continuation logic.
────────────────────────────
📝 Summary
• EMA 100 High–Low Band defines balance and value.
• Price consolidates inside the band for multiple sessions.
• Swing-based trendlines show structural compression.
• Volume expands during consolidation, indicating participation.
• Validation and devalidation lines define acceptance and failure zones.
• Target and revalidation levels provide structured projection and protection.
• The idea focuses on structure resolution, not prediction.
• Direction is assessed only after acceptance, not anticipation.
────────────────────────────
⚠️ Disclaimer
📘 For educational purposes only.
🙅 Not SEBI registered.
❌ Not a buy/sell recommendation.
🧠 Purely a learning resource.
📊 Not Financial Advice.

Pine Script Developer • Market Analysis
Wyłączenie odpowiedzialności
Informacje i publikacje nie stanowią i nie powinny być traktowane jako porady finansowe, inwestycyjne, tradingowe ani jakiekolwiek inne rekomendacje dostarczane lub zatwierdzone przez TradingView. Więcej informacji znajduje się w Warunkach użytkowania.
Pine Script Developer • Market Analysis
Wyłączenie odpowiedzialności
Informacje i publikacje nie stanowią i nie powinny być traktowane jako porady finansowe, inwestycyjne, tradingowe ani jakiekolwiek inne rekomendacje dostarczane lub zatwierdzone przez TradingView. Więcej informacji znajduje się w Warunkach użytkowania.