BlackRock ( BLK): Symmetrical Triangle Compression – Range Inefficient Trading vs. Macro Breakout Vectors
### 💼 BlackRock Inc. (BLK) Daily Technical Framework (Ref: BLK_2026-06-17_10-12-33.png)
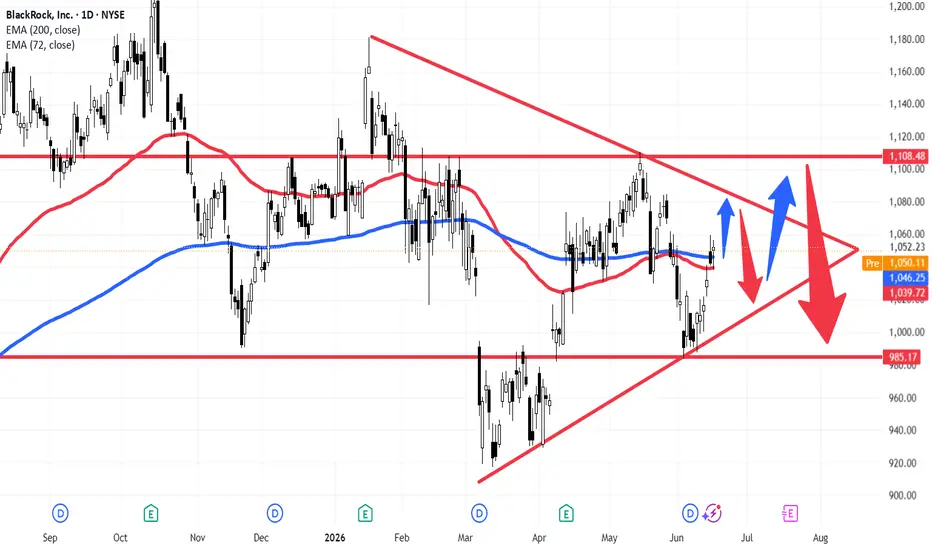
We are tracking a highly defined, multi-month structural compression pattern on BlackRock Inc. (BLK - NYSE) on the Daily (1D) chart.
The stock concluded its last formal session up **+0.29% at 1,052.23**, with pre-market data prints hovering slightly lower near **1,050.11**. Price action is now deeply locked inside a massive, tightening **Symmetrical Triangle** framework, which is developing within a broader macro consolidation trading range.
---
### 🔍 Structural Geometry & Cluster Confluence:
1. **The Overhead Descending Trendline (LTB):** Connecting the structural lower highs since the January peaks. Price is currently expanding upward toward a retest of this diagonal supply barrier (as indicated by the immediate blue arrow).
2. **The Lower Ascending Trendline (LTA):** Formed by the consecutive higher lows established since March, providing a reliable demand floor for swing long positions.
3. **The Exponential Moving Average Cluster:** Both the long-term **200-period EMA (blue line at 1,046.25)** and the intermediate **72-period EMA (red line at 1,039.72)** have completely flattened out and entangled. This behavior is a textbook indicator of a non-trending, highly compressed market equilibrium where moving averages act as an axis rather than a dynamic trend guide.
4. **The Macro Range Limits:** The overall accumulation block is heavily defined by two major horizontal boundaries: resistance supply at **1,108.48** and a key historical demand floor at **985.17**.
---
### ⚡ Operational Playbook: Two-Phase Execution
* **Phase 1: Inside-the-Range Mean Reversion (Immediate Setup)**
As long as the price remains bound within the converging boundaries of the triangle, the optimal strategy focuses on range-bound execution. Traders can look to deploy capital to short/sell near the upper diagonal LTB and buy/long near the lower diagonal LTA, capturing the rotational waves (noted by the alternating blue and red internal vectors).
* **Phase 2: The Apex Volatility Expansion (The Breakout Setup)**
As the price action pushes closer to the apex of the triangle, volatility will inevitably collapse before exploding into a directional expansion. We must maintain high alertness for a decisive daily candle close outside either trendline boundary:
* **Upside Escape:** A clean breakout above the LTB opens a rapid liquidity pocket to test the **1,108.48** macro ceiling.
* **Downside Escape:** A breakdown below the LTA (as projected by the large red extension arrow near the apex) will signal a major institutional distribution phase, paving the way for a sharp wave downward into the crucial macro baseline support floor at **985.17**.
### Summary:
Trade the boundaries with tight risk definitions for now, but save core allocation capacity for the ultimate breakout confirmation.
---
📊 **ChartPro Data** | By Rogerio Zaglia
*Institutional Asset Research, Geometric Compression & Systematic Range Management.*
⚠️ **Disclaimer:** For educational and informational purposes only. This technical analysis represents a personal trading framework and does not constitute financial or investment advice.
BLK): Symmetrical Triangle Compression – Range Inefficient Trading vs. Macro Breakout Vectors### 💼 BlackRock Inc. (
BLK) Daily Technical Framework (Ref: BLK_2026-06-17_10-12-33.png)We are tracking a highly defined, multi-month structural compression pattern on BlackRock Inc. (
BLK - NYSE) on the Daily (1D) chart. The stock concluded its last formal session up **+0.29% at 1,052.23**, with pre-market data prints hovering slightly lower near **1,050.11**. Price action is now deeply locked inside a massive, tightening **Symmetrical Triangle** framework, which is developing within a broader macro consolidation trading range.
---
### 🔍 Structural Geometry & Cluster Confluence:
1. **The Overhead Descending Trendline (LTB):** Connecting the structural lower highs since the January peaks. Price is currently expanding upward toward a retest of this diagonal supply barrier (as indicated by the immediate blue arrow).
2. **The Lower Ascending Trendline (LTA):** Formed by the consecutive higher lows established since March, providing a reliable demand floor for swing long positions.
3. **The Exponential Moving Average Cluster:** Both the long-term **200-period EMA (blue line at 1,046.25)** and the intermediate **72-period EMA (red line at 1,039.72)** have completely flattened out and entangled. This behavior is a textbook indicator of a non-trending, highly compressed market equilibrium where moving averages act as an axis rather than a dynamic trend guide.
4. **The Macro Range Limits:** The overall accumulation block is heavily defined by two major horizontal boundaries: resistance supply at **1,108.48** and a key historical demand floor at **985.17**.
---
### ⚡ Operational Playbook: Two-Phase Execution
* **Phase 1: Inside-the-Range Mean Reversion (Immediate Setup)**
As long as the price remains bound within the converging boundaries of the triangle, the optimal strategy focuses on range-bound execution. Traders can look to deploy capital to short/sell near the upper diagonal LTB and buy/long near the lower diagonal LTA, capturing the rotational waves (noted by the alternating blue and red internal vectors).
* **Phase 2: The Apex Volatility Expansion (The Breakout Setup)**
As the price action pushes closer to the apex of the triangle, volatility will inevitably collapse before exploding into a directional expansion. We must maintain high alertness for a decisive daily candle close outside either trendline boundary:
* **Upside Escape:** A clean breakout above the LTB opens a rapid liquidity pocket to test the **1,108.48** macro ceiling.
* **Downside Escape:** A breakdown below the LTA (as projected by the large red extension arrow near the apex) will signal a major institutional distribution phase, paving the way for a sharp wave downward into the crucial macro baseline support floor at **985.17**.
### Summary:
Trade the boundaries with tight risk definitions for now, but save core allocation capacity for the ultimate breakout confirmation.
---
📊 **ChartPro Data** | By Rogerio Zaglia
*Institutional Asset Research, Geometric Compression & Systematic Range Management.*
⚠️ **Disclaimer:** For educational and informational purposes only. This technical analysis represents a personal trading framework and does not constitute financial or investment advice.

Wyłączenie odpowiedzialności
Informacje i publikacje nie stanowią i nie powinny być traktowane jako porady finansowe, inwestycyjne, tradingowe ani jakiekolwiek inne rekomendacje dostarczane lub zatwierdzone przez TradingView. Więcej informacji znajduje się w Warunkach użytkowania.
Wyłączenie odpowiedzialności
Informacje i publikacje nie stanowią i nie powinny być traktowane jako porady finansowe, inwestycyjne, tradingowe ani jakiekolwiek inne rekomendacje dostarczane lub zatwierdzone przez TradingView. Więcej informacji znajduje się w Warunkach użytkowania.