Zaktualizowano
BLZBTC H&D Pattern.
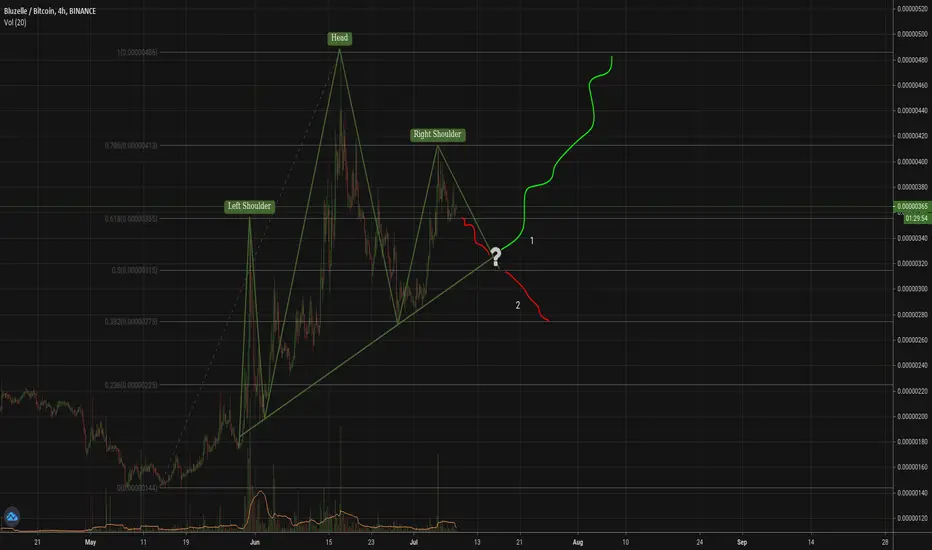
So, basically that's kind of valid H&D pattern that occurred on 4h chart. That kind of H&D pattern is usually followed up by price decline, and in order to somehow predict approximate support price level, I used Fibonacci levels. According to Fibonacci levels, price can drop to 0.386 level, which is ~= 280 satoshis.
On the other hand, if we look at scenario 1, it can happen if price stays above Fibonacci 0.5 level, and price will continue it's upward movement.
In any case, price should rise gradually, as if one looks at 1D-1W price chart, BLZBTC has broken falling wedge/channel recently with high volume spike and price increase.
I will only invest in it, if price stays above 0.5 level. Good luck with your trades !
https://excellenceassured.com/wp-content/uploads/2017/04/Head-Shoulders-Chart-Patterns-on-the-DAX-April-2017.png
Zlecenie aktywne
H&D failed, going to scenario 1
Wyłączenie odpowiedzialności
Informacje i publikacje nie stanowią i nie powinny być traktowane jako porady finansowe, inwestycyjne, tradingowe ani jakiekolwiek inne rekomendacje dostarczane lub zatwierdzone przez TradingView. Więcej informacji znajduje się w Warunkach użytkowania.
Wyłączenie odpowiedzialności
Informacje i publikacje nie stanowią i nie powinny być traktowane jako porady finansowe, inwestycyjne, tradingowe ani jakiekolwiek inne rekomendacje dostarczane lub zatwierdzone przez TradingView. Więcej informacji znajduje się w Warunkach użytkowania.