
Binance (BNB) technical analysis:
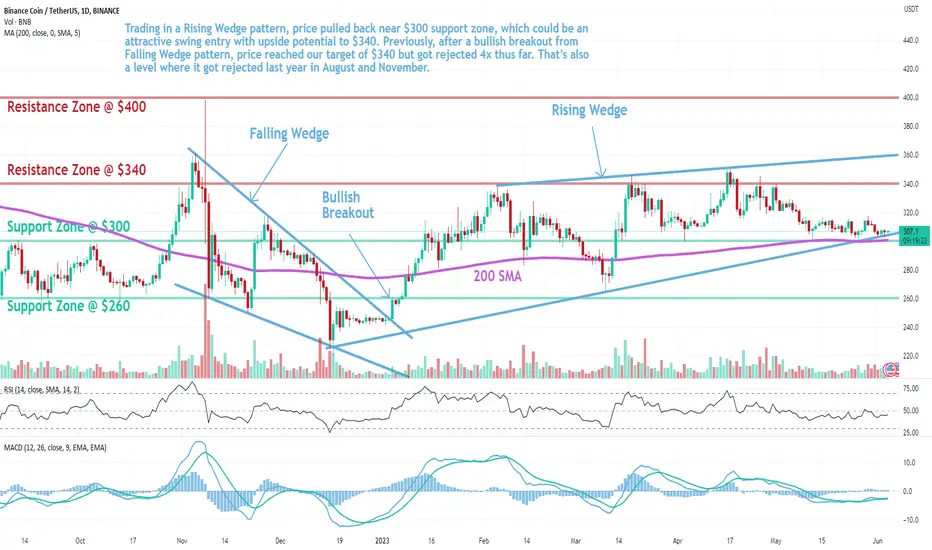
Trade setup: Trading in a Rising Wedge pattern, price pulled back near $300 support zone, which could be an attractive swing entry with upside potential to $340. Previously, after a bullish breakout from Falling Wedge pattern, price reached our target of $340 but got rejected 4x thus far. That’s also a level where it got rejected last year in August and November.
Patterns: Rising Wedge It usually forms after an uptrend and suggests a potential bearish reversal in the original uptrend. When price breaks the lower trend line the price is expected to trend lower. Emerging patterns (before a breakout occurs) can be traded by swing traders between the convergence lines; however, most traders should wait for a completed pattern with a breakout.
Trend: Downtrend on Short- and Medium-Term basis and Uptrend on Long-Term basis.
Momentum is Mixed as MACD Line is above MACD Signal Line (Bullish) but RSI < 45 (Bearish). MACD Histogram bars are declining, which suggests that momentum is weakening.
Support and Resistance: Nearest Support Zone is $300 (previous resistance), then $260. The nearest Resistance Zone is $340, then $400.
Trade setup: Trading in a Rising Wedge pattern, price pulled back near $300 support zone, which could be an attractive swing entry with upside potential to $340. Previously, after a bullish breakout from Falling Wedge pattern, price reached our target of $340 but got rejected 4x thus far. That’s also a level where it got rejected last year in August and November.
Patterns: Rising Wedge It usually forms after an uptrend and suggests a potential bearish reversal in the original uptrend. When price breaks the lower trend line the price is expected to trend lower. Emerging patterns (before a breakout occurs) can be traded by swing traders between the convergence lines; however, most traders should wait for a completed pattern with a breakout.
Trend: Downtrend on Short- and Medium-Term basis and Uptrend on Long-Term basis.
Momentum is Mixed as MACD Line is above MACD Signal Line (Bullish) but RSI < 45 (Bearish). MACD Histogram bars are declining, which suggests that momentum is weakening.
Support and Resistance: Nearest Support Zone is $300 (previous resistance), then $260. The nearest Resistance Zone is $340, then $400.

Wyłączenie odpowiedzialności
Informacje i publikacje nie stanowią i nie powinny być traktowane jako porady finansowe, inwestycyjne, tradingowe ani jakiekolwiek inne rekomendacje dostarczane lub zatwierdzone przez TradingView. Więcej informacji znajduje się w Warunkach użytkowania.
Wyłączenie odpowiedzialności
Informacje i publikacje nie stanowią i nie powinny być traktowane jako porady finansowe, inwestycyjne, tradingowe ani jakiekolwiek inne rekomendacje dostarczane lub zatwierdzone przez TradingView. Więcej informacji znajduje się w Warunkach użytkowania.