
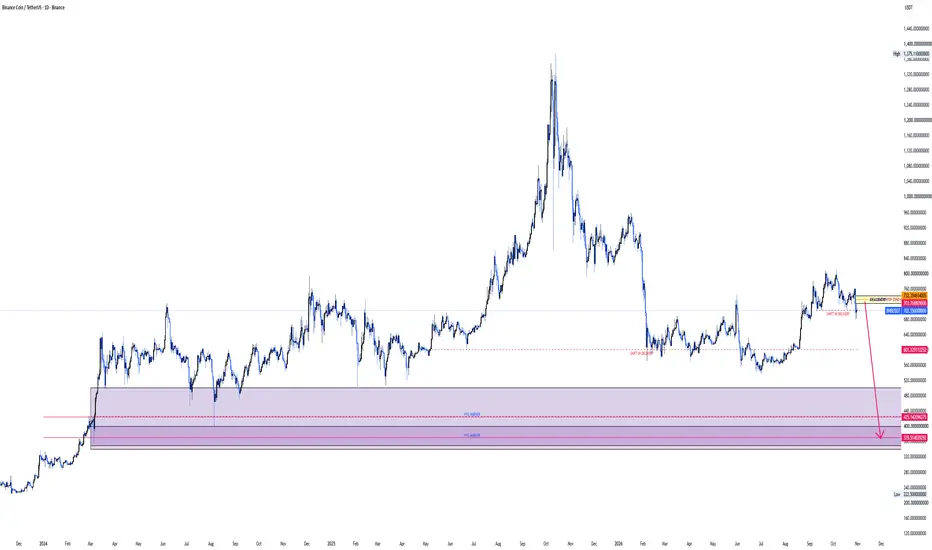
On the 12 month chart, price is yet to contact the imbalance at 425 indicating a possibility of a bearish price correction. On the 6 month chart, an additional imbalance is identified at 370 price handle.
On the monthly chart, we have a shift in market structure from bullish to bearish confirming possibility of price pushing lower to clear the market imbalance mentioned earlier. The daily chart further confirms a shift in market structure as price is expected to push lower. Our sell limit is placed at 732.4, our exit is either the medium term target at 425.15 or long term target at 370.51.
On the monthly chart, we have a shift in market structure from bullish to bearish confirming possibility of price pushing lower to clear the market imbalance mentioned earlier. The daily chart further confirms a shift in market structure as price is expected to push lower. Our sell limit is placed at 732.4, our exit is either the medium term target at 425.15 or long term target at 370.51.

Join my private groups [ Forex swing/position market calls] &[ Buy and Hold Crypto market calls]
afroswing.gumroad.com/
afroswing.gumroad.com/
Powiązane publikacje
Wyłączenie odpowiedzialności
Informacje i publikacje nie stanowią i nie powinny być traktowane jako porady finansowe, inwestycyjne, tradingowe ani jakiekolwiek inne rekomendacje dostarczane lub zatwierdzone przez TradingView. Więcej informacji znajduje się w Warunkach użytkowania.
Join my private groups [ Forex swing/position market calls] &[ Buy and Hold Crypto market calls]
afroswing.gumroad.com/
afroswing.gumroad.com/
Powiązane publikacje
Wyłączenie odpowiedzialności
Informacje i publikacje nie stanowią i nie powinny być traktowane jako porady finansowe, inwestycyjne, tradingowe ani jakiekolwiek inne rekomendacje dostarczane lub zatwierdzone przez TradingView. Więcej informacji znajduje się w Warunkach użytkowania.