
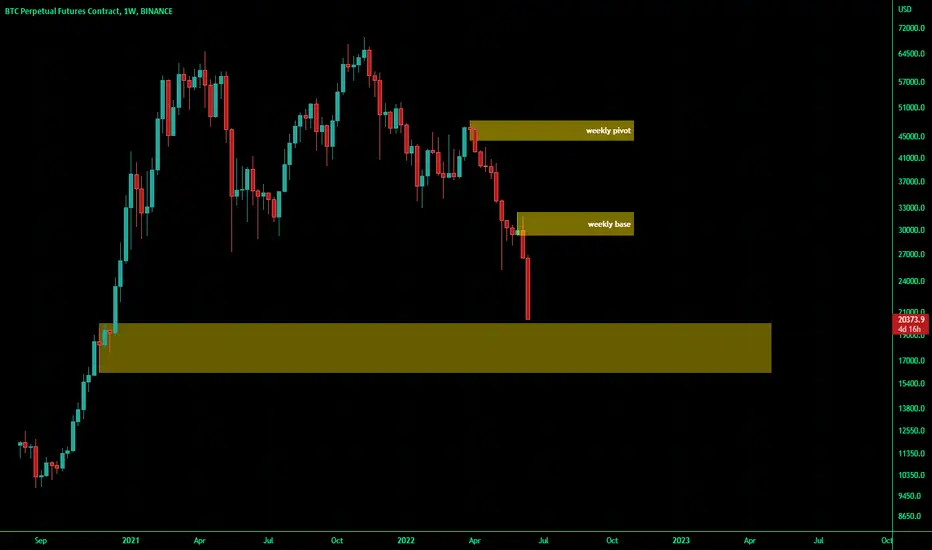
from supply and demand analysis point of view,
the areas that can clearly be seen on the chart are these yellow rectangles the analysis is like having the price stop running down on the lowest area and start an upward to the first green candle and the price will be in a trading range for while (1 year or 2 maybe )
the areas that can clearly be seen on the chart are these yellow rectangles the analysis is like having the price stop running down on the lowest area and start an upward to the first green candle and the price will be in a trading range for while (1 year or 2 maybe )

Wyłączenie odpowiedzialności
Informacje i publikacje nie stanowią i nie powinny być traktowane jako porady finansowe, inwestycyjne, tradingowe ani jakiekolwiek inne rekomendacje dostarczane lub zatwierdzone przez TradingView. Więcej informacji znajduje się w Warunkach użytkowania.
Wyłączenie odpowiedzialności
Informacje i publikacje nie stanowią i nie powinny być traktowane jako porady finansowe, inwestycyjne, tradingowe ani jakiekolwiek inne rekomendacje dostarczane lub zatwierdzone przez TradingView. Więcej informacji znajduje się w Warunkach użytkowania.