
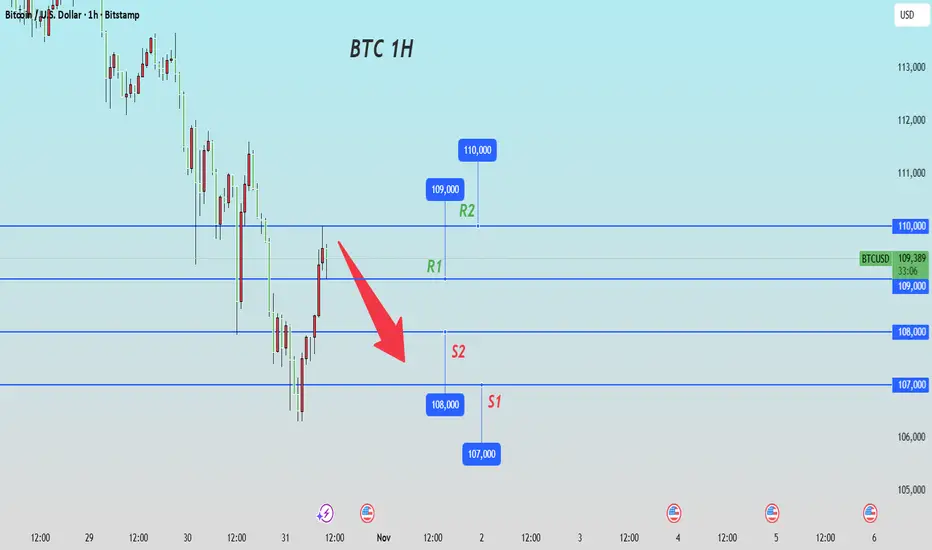
Technical aspect: "Support broken + Trend continuation", the bearish dominant pattern has been established
The price has successfully broken through the key support range: $109,100 is located between the psychological threshold of $110,000 and the 200-day moving average ($107,846). The 1-hour chart shows that after the price continuously attempted to reach $110,000 for 3 times without success, it formed a "head and shoulders top" pattern and broke through, with the neckline at $109,500 being lost. After that, the decline measured pointed to $107,000. More importantly, the 50-day moving average at the daily level has crossed below the 100-day moving average, forming a "death cross". This is the first medium-term bearish signal since 2024 May. Historical data shows that when such a technical combination occurs, the average decline within 5 trading days is 5.3%. Meanwhile, although the RSI indicator has entered the oversold zone, there is no divergence signal, indicating that the downward momentum has not yet exhausted.
Today's Bitcoin Trading Strategy
sell:109000-110000
tp:108000-107000
sl:111000
Zlecenie aktywne
Wish you a wonderful day!
Wyłączenie odpowiedzialności
Informacje i publikacje nie stanowią i nie powinny być traktowane jako porady finansowe, inwestycyjne, tradingowe ani jakiekolwiek inne rekomendacje dostarczane lub zatwierdzone przez TradingView. Więcej informacji znajduje się w Warunkach użytkowania.
Wyłączenie odpowiedzialności
Informacje i publikacje nie stanowią i nie powinny być traktowane jako porady finansowe, inwestycyjne, tradingowe ani jakiekolwiek inne rekomendacje dostarczane lub zatwierdzone przez TradingView. Więcej informacji znajduje się w Warunkach użytkowania.