
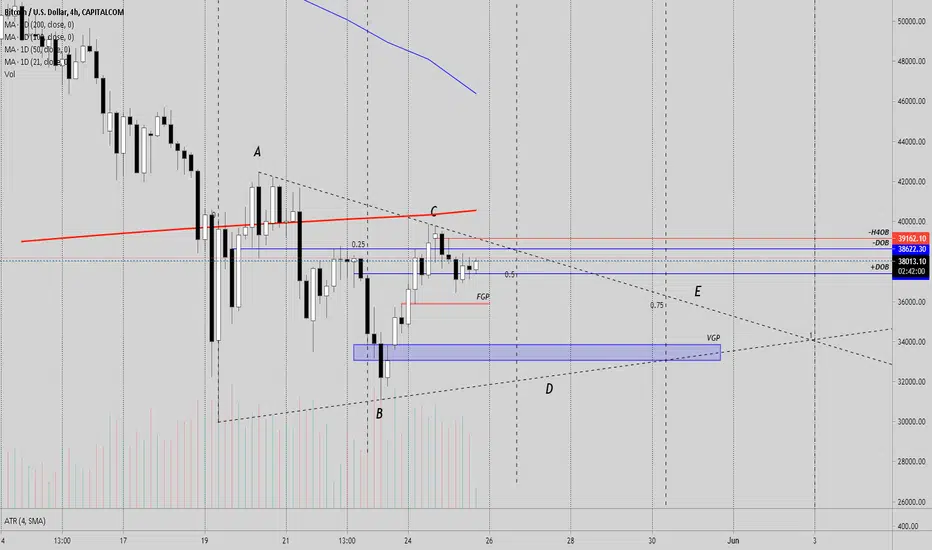
Bitcoin - After digging further into recent price action of Bitcoin on the 4 hour chart by clearing off the chart and removing previous analysis, I have discovered that we could be having some type of sideways pennant pattern forming. Pennants usually form after a very long bull or bear run and usually take one to three weeks to form. In the chart above I have laid out the anticipated projection of this sideways pennant with the relative percentages of completion. It is anticipated that we will have bearish and bullish legs forming up into June at which time we should see a continuation of the downtrend.
**** This is my own analysis and not trading advice.
**** This is my own analysis and not trading advice.

Powiązane publikacje
Wyłączenie odpowiedzialności
Informacje i publikacje nie stanowią i nie powinny być traktowane jako porady finansowe, inwestycyjne, tradingowe ani jakiekolwiek inne rekomendacje dostarczane lub zatwierdzone przez TradingView. Więcej informacji znajduje się w Warunkach użytkowania.
Powiązane publikacje
Wyłączenie odpowiedzialności
Informacje i publikacje nie stanowią i nie powinny być traktowane jako porady finansowe, inwestycyjne, tradingowe ani jakiekolwiek inne rekomendacje dostarczane lub zatwierdzone przez TradingView. Więcej informacji znajduje się w Warunkach użytkowania.