
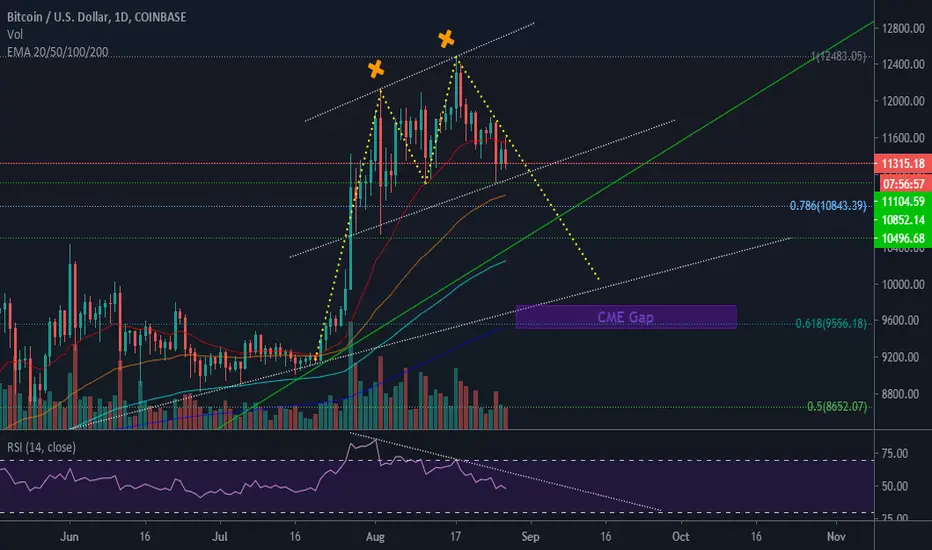
Double top pattern formed clearly followed by a descending RSI and Volume. Besides a bearish divergence is noticed at the tops.
Supports:
Ps: The support at 10.5K is strong, So I expect it to just draw a shadow to 9750 if it's supposed to fill the gap.
Supports:
- 11100
- 10850
- 10496
- 9750
Ps: The support at 10.5K is strong, So I expect it to just draw a shadow to 9750 if it's supposed to fill the gap.
Zlecenie aktywne
Pattern switched to Head and Shoulders following the Total Market Cap chart. The price broke almost all supports to 9750. The last lowest price was 9960 and the CME Gap is still unfilled

Powiązane publikacje
Wyłączenie odpowiedzialności
Informacje i publikacje nie stanowią i nie powinny być traktowane jako porady finansowe, inwestycyjne, tradingowe ani jakiekolwiek inne rekomendacje dostarczane lub zatwierdzone przez TradingView. Więcej informacji znajduje się w Warunkach użytkowania.
Powiązane publikacje
Wyłączenie odpowiedzialności
Informacje i publikacje nie stanowią i nie powinny być traktowane jako porady finansowe, inwestycyjne, tradingowe ani jakiekolwiek inne rekomendacje dostarczane lub zatwierdzone przez TradingView. Więcej informacji znajduje się w Warunkach użytkowania.