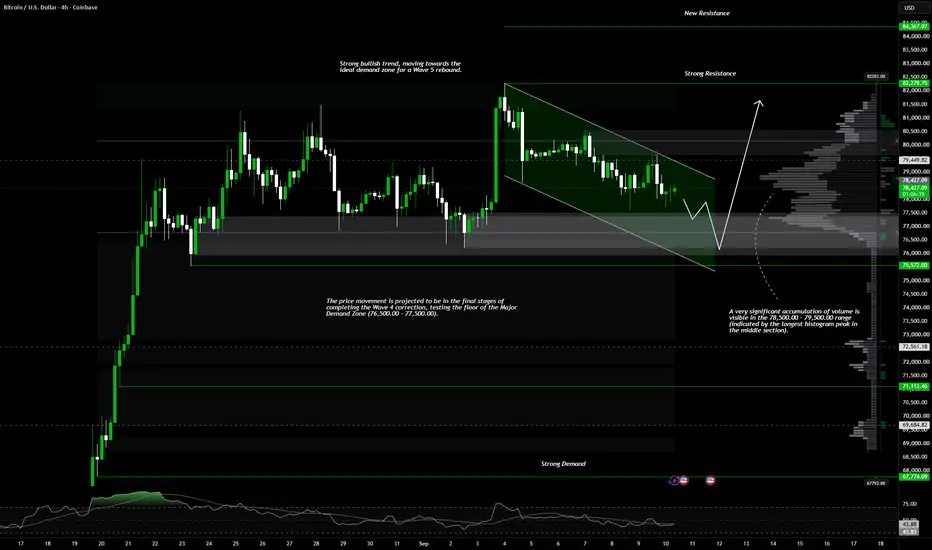
The macro H4 structure remains within a Bullish/Wide Range-Bound pattern, with the local peak established near the green line at 82,279.75.  BTCUSD
A gradual decline from that peak has formed a minor "Lower High" pattern, pushing the price toward the central consolidation area.
At the 78,139.84 price level, the latest H4 candle shows mild selling pressure, driving the price below the 79,449.82 horizontal line.
This decline is heading directly into the Major Demand Zone (central gray box) within the 76,000.00 – 77,500.00 range.
-------------------------------------------------------------------------------------------------------------
✅ Key Zones:
- ⚡Resistance / Supply Zone: The 79,449.82 horizontal line range (nearest Support-Turned-Resistance/SBR area) and the 82,279.75 green line range (Major Supply Zone peak).
- ⚡Support / Demand Zone: The 76,000.00 – 77,500.00 range (central gray box / Major Demand Zone—critical for a potential rebound) and the 75,572.00 green line (lowest invalidation support level).
-------------------------------------------------------------------------------------------------------------
✅ Orderflow / Volume Profile (VPVR) Analysis
The Volume Profile histogram on the right side of the chart provides a precise map of institutional liquidity:
- ⚡Local High Volume Node (HVN) / Point of Control (POC):
A significant volume accumulation is visible in the 78,500.00 – 79,500.00 range (indicated by the longest histogram protrusion in the middle section).
- ⚡Lower Defense High Volume Node (HVN):
Directly below the current price (76,500.00 – 77,500.00), another thick volume wall has formed, coinciding with the gray Demand box.
- ⚡Low Volume Node (LVN) / Volume Vacuum Area Below 75,500:
Below the green line at 75,572.00, the volume histogram appears extremely thin (a volume vacuum). This indicates that the 75,572.00 – 76,000.00 defense zone is critical; if this area holds, the market is likely to stage a strong rebound.
-------------------------------------------------------------------------------------------------------------
✅ Elliott Wave Analysis
Mapping wave cycle movements on the H4 timeframe:
⚡Wave Structure:
The vertical impulsive rally from the lows to the 82,279.75 peak is calculated as an expansion of Wave 3 (or a macro Wave A).
⚡Current Status:
The gradual decline from the 82,279.75 peak toward 78,139.84 is identified as the formation of Wave 4 (a corrective wave), characterized by a gradual corrective structure (zigzag/channeling pullback).
⚡Projection:
Price action is projected to be in the final stages of completing the Wave 4 correction, testing the floor of the Major Demand Zone (76,500.00 – 77,500.00). Once this Wave 4 cycle concludes above the green line at 75,572.00, the market is projected to launch a major impulsive Wave 5 push to break back above the 82,279.75 peak.
BTCUSD A gradual decline from that peak has formed a minor "Lower High" pattern, pushing the price toward the central consolidation area.
At the 78,139.84 price level, the latest H4 candle shows mild selling pressure, driving the price below the 79,449.82 horizontal line.
This decline is heading directly into the Major Demand Zone (central gray box) within the 76,000.00 – 77,500.00 range.
-------------------------------------------------------------------------------------------------------------
✅ Key Zones:
- ⚡Resistance / Supply Zone: The 79,449.82 horizontal line range (nearest Support-Turned-Resistance/SBR area) and the 82,279.75 green line range (Major Supply Zone peak).
- ⚡Support / Demand Zone: The 76,000.00 – 77,500.00 range (central gray box / Major Demand Zone—critical for a potential rebound) and the 75,572.00 green line (lowest invalidation support level).
-------------------------------------------------------------------------------------------------------------
✅ Orderflow / Volume Profile (VPVR) Analysis
The Volume Profile histogram on the right side of the chart provides a precise map of institutional liquidity:
- ⚡Local High Volume Node (HVN) / Point of Control (POC):
A significant volume accumulation is visible in the 78,500.00 – 79,500.00 range (indicated by the longest histogram protrusion in the middle section).
- ⚡Lower Defense High Volume Node (HVN):
Directly below the current price (76,500.00 – 77,500.00), another thick volume wall has formed, coinciding with the gray Demand box.
- ⚡Low Volume Node (LVN) / Volume Vacuum Area Below 75,500:
Below the green line at 75,572.00, the volume histogram appears extremely thin (a volume vacuum). This indicates that the 75,572.00 – 76,000.00 defense zone is critical; if this area holds, the market is likely to stage a strong rebound.
-------------------------------------------------------------------------------------------------------------
✅ Elliott Wave Analysis
Mapping wave cycle movements on the H4 timeframe:
⚡Wave Structure:
The vertical impulsive rally from the lows to the 82,279.75 peak is calculated as an expansion of Wave 3 (or a macro Wave A).
⚡Current Status:
The gradual decline from the 82,279.75 peak toward 78,139.84 is identified as the formation of Wave 4 (a corrective wave), characterized by a gradual corrective structure (zigzag/channeling pullback).
⚡Projection:
Price action is projected to be in the final stages of completing the Wave 4 correction, testing the floor of the Major Demand Zone (76,500.00 – 77,500.00). Once this Wave 4 cycle concludes above the green line at 75,572.00, the market is projected to launch a major impulsive Wave 5 push to break back above the 82,279.75 peak.

Powiązane publikacje
Wyłączenie odpowiedzialności
Informacje i publikacje nie stanowią i nie powinny być traktowane jako porady finansowe, inwestycyjne, tradingowe ani jakiekolwiek inne rekomendacje dostarczane lub zatwierdzone przez TradingView. Więcej informacji znajduje się w Warunkach użytkowania.
Powiązane publikacje
Wyłączenie odpowiedzialności
Informacje i publikacje nie stanowią i nie powinny być traktowane jako porady finansowe, inwestycyjne, tradingowe ani jakiekolwiek inne rekomendacje dostarczane lub zatwierdzone przez TradingView. Więcej informacji znajduje się w Warunkach użytkowania.