
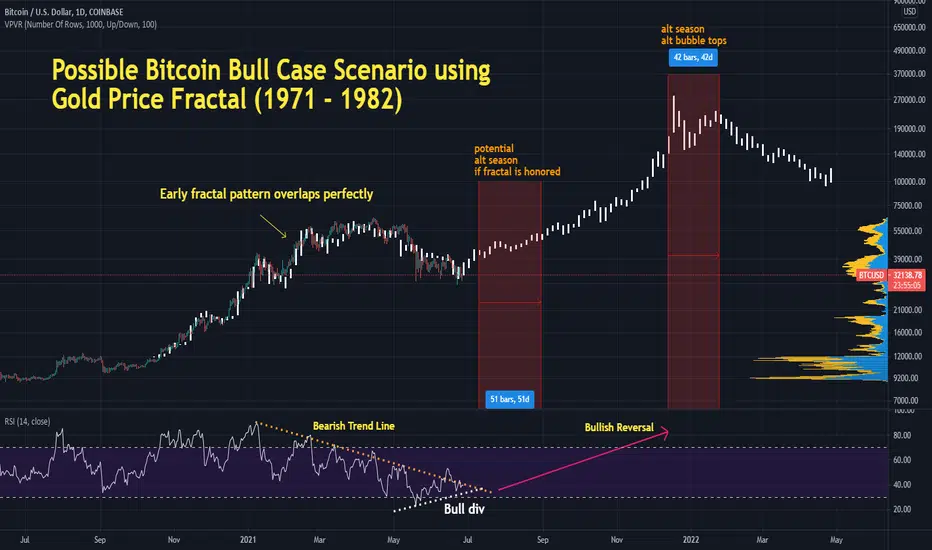
Here is an update on my previous idea. The fractal pattern is playing out well. While my last chart was on the weekly, on the daily, I see what appears to be the beginning of a bullish divergence on the RSI.
This means that bearish action is losing momentum. To confirm this, we need to see a bullish divergence on the weekly too to suggest we are on a secular long term trend.
This is analogous to my previous charts where the RSI was showing bearish divergences (see links below) while price was going up suggesting bullish momentum is on a decline.
If price breaks below 25k, this idea will be invalidated.
This means that bearish action is losing momentum. To confirm this, we need to see a bullish divergence on the weekly too to suggest we are on a secular long term trend.
This is analogous to my previous charts where the RSI was showing bearish divergences (see links below) while price was going up suggesting bullish momentum is on a decline.
If price breaks below 25k, this idea will be invalidated.

Powiązane publikacje
Wyłączenie odpowiedzialności
Informacje i publikacje nie stanowią i nie powinny być traktowane jako porady finansowe, inwestycyjne, tradingowe ani jakiekolwiek inne rekomendacje dostarczane lub zatwierdzone przez TradingView. Więcej informacji znajduje się w Warunkach użytkowania.
Powiązane publikacje
Wyłączenie odpowiedzialności
Informacje i publikacje nie stanowią i nie powinny być traktowane jako porady finansowe, inwestycyjne, tradingowe ani jakiekolwiek inne rekomendacje dostarczane lub zatwierdzone przez TradingView. Więcej informacji znajduje się w Warunkach użytkowania.