
📈 Chart Pattern:
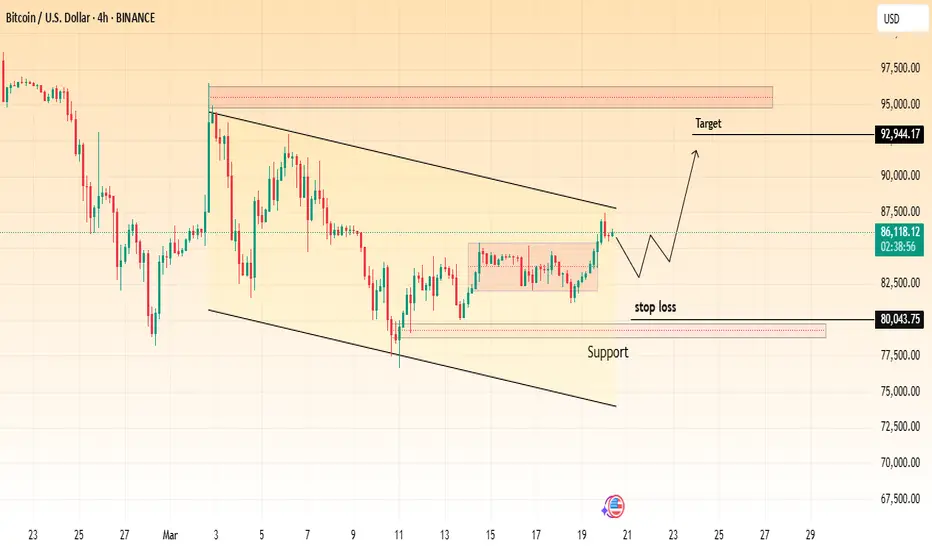
Bitcoin has been trading inside a descending channel for several weeks. Recently, BTC has broken out of the channel’s upper boundary, indicating a potential shift in momentum.
🔹 Key Levels:
Support: $80,043.75 (Critical stop-loss level)
Resistance: $87,500 (Short-term)
Target: $92,944.17 (Upside projection)
📊 Trading Plan:
BTC might retest the breakout zone before continuing the upward move.
A confirmed higher low formation could signal strong bullish momentum.
If BTC remains above $85,500, further upside toward $92,944.17 is possible.
⚠️ Risk Management:
If BTC drops below $80,043.75, the bullish setup could become invalid.
Traders should wait for confirmation before entering long positions.
💡 Conclusion:
This breakout could lead to a strong uptrend, but traders should watch for a successful retest before making a move. 🚀🔍
Bitcoin has been trading inside a descending channel for several weeks. Recently, BTC has broken out of the channel’s upper boundary, indicating a potential shift in momentum.
🔹 Key Levels:
Support: $80,043.75 (Critical stop-loss level)
Resistance: $87,500 (Short-term)
Target: $92,944.17 (Upside projection)
📊 Trading Plan:
BTC might retest the breakout zone before continuing the upward move.
A confirmed higher low formation could signal strong bullish momentum.
If BTC remains above $85,500, further upside toward $92,944.17 is possible.
⚠️ Risk Management:
If BTC drops below $80,043.75, the bullish setup could become invalid.
Traders should wait for confirmation before entering long positions.
💡 Conclusion:
This breakout could lead to a strong uptrend, but traders should watch for a successful retest before making a move. 🚀🔍

Wyłączenie odpowiedzialności
Informacje i publikacje nie stanowią i nie powinny być traktowane jako porady finansowe, inwestycyjne, tradingowe ani jakiekolwiek inne rekomendacje dostarczane lub zatwierdzone przez TradingView. Więcej informacji znajduje się w Warunkach użytkowania.
Wyłączenie odpowiedzialności
Informacje i publikacje nie stanowią i nie powinny być traktowane jako porady finansowe, inwestycyjne, tradingowe ani jakiekolwiek inne rekomendacje dostarczane lub zatwierdzone przez TradingView. Więcej informacji znajduje się w Warunkach użytkowania.