
As a comment of my previous idea published this morning,
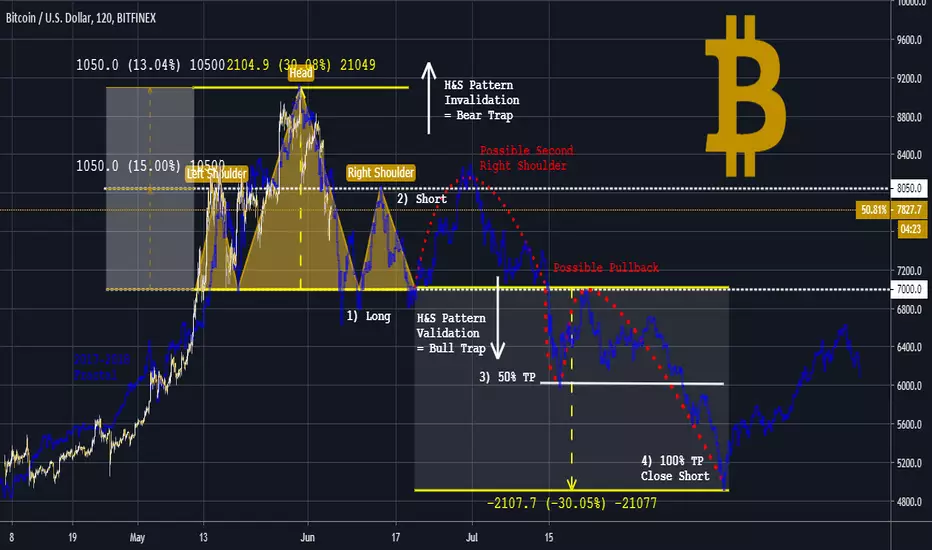
I wisely pointed out that the neck line of my H&S is more logically on the psychological $7000
So here is my modified chart, which makes my target even more bearish:
A FIRST LEVEL AT $6000 THEN A SECOND SUB-$5000...
which is much more consistent with my previous analysis elsewhere! (see Related Ideas below)
I also validated this chart with a fractal of the bursting of the 2017 bubble (in blue)
which reminds that a second right shoulder is possible in case the bulls are slow to surrender
I remind you that this is only a hypothesis, certainly very plausible
BUT which requires preliminary intermediate validations as indicated on my chart !
I wisely pointed out that the neck line of my H&S is more logically on the psychological $7000
So here is my modified chart, which makes my target even more bearish:
A FIRST LEVEL AT $6000 THEN A SECOND SUB-$5000...
which is much more consistent with my previous analysis elsewhere! (see Related Ideas below)
I also validated this chart with a fractal of the bursting of the 2017 bubble (in blue)
which reminds that a second right shoulder is possible in case the bulls are slow to surrender
I remind you that this is only a hypothesis, certainly very plausible
BUT which requires preliminary intermediate validations as indicated on my chart !

Powiązane publikacje
Wyłączenie odpowiedzialności
Informacje i publikacje nie stanowią i nie powinny być traktowane jako porady finansowe, inwestycyjne, tradingowe ani jakiekolwiek inne rekomendacje dostarczane lub zatwierdzone przez TradingView. Więcej informacji znajduje się w Warunkach użytkowania.
Powiązane publikacje
Wyłączenie odpowiedzialności
Informacje i publikacje nie stanowią i nie powinny być traktowane jako porady finansowe, inwestycyjne, tradingowe ani jakiekolwiek inne rekomendacje dostarczane lub zatwierdzone przez TradingView. Więcej informacji znajduje się w Warunkach użytkowania.