
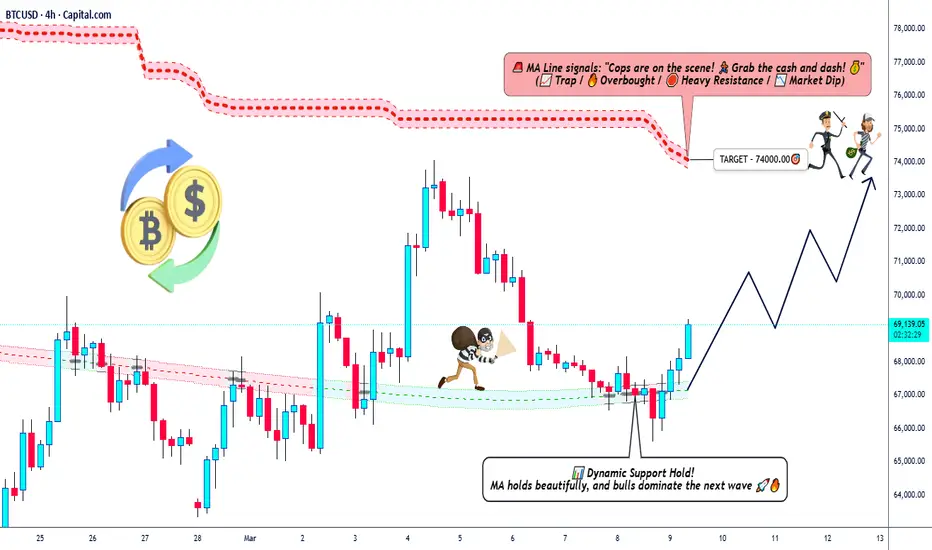
🚀 BTC/USDT — BITCOIN vs TETHER
Crypto Market Profit Pathway Setup | Day / Swing Trade
Asset: BTC/USDT — Bitcoin vs Tether
Market: Cryptocurrency
Trading Style: Day / Swing Trade
Directional Bias: 📈 Bullish Plan
🧭 Trade Plan Overview
Bitcoin continues to show institutional accumulation signals after defending major demand zones. Market structure suggests that liquidity is being built for a potential continuation move.
This setup focuses on trend continuation with volatility expansion after consolidation.
Entry:
Traders may consider entries based on their own preferred price level, confirmation candle, or liquidity sweep setup.
⚠️ Always wait for confirmation from your own strategy.
🎯 Target Projection
Primary Target: $74,000
Reasons behind the target zone:
• The moving average cluster above price often acts like a “market police force,” creating strong resistance zones.
• Current structure indicates a possible liquidity trap for late buyers near resistance.
• Correlation signals suggest the market may push toward liquidity above recent highs before distribution.
💡 Smart traders may scale profits around liquidity pools near the 74K zone.
🛑 Risk Management
Stop Loss (Thief SL): $65,000
This level represents a structural invalidation zone where bullish market structure would weaken.
⚠️ Important note:
This stop loss is only part of the analysis idea. Risk management is always your personal decision.
Trade smart. Protect capital first.
🌐 Macro & Fundamental Drivers (Latest Market Context)
Several macroeconomic and geopolitical factors are currently influencing Bitcoin price behavior:
🏦 Federal Reserve Policy
Interest rate expectations and liquidity conditions remain the largest macro drivers for crypto markets. If inflation remains elevated, tighter monetary policy may limit Bitcoin’s upside.
💵 US Dollar Index (DXY)
Bitcoin often moves inversely to the U.S. Dollar Index. When the dollar strengthens, crypto assets tend to face downward pressure.
📊 Risk-Asset Correlation
Bitcoin frequently behaves like a high-beta risk asset similar to tech stocks, showing correlation with major indices like Nasdaq during liquidity cycles.
🌍 Geopolitical & Macro Volatility
Recent geopolitical tensions and macro uncertainty have increased volatility, while Bitcoin recently pushed toward the $73K–$74K area during risk-on sentiment shifts.
📅 Upcoming Economic Catalysts
Watch these macro events carefully:
• US CPI Inflation Data
• Federal Reserve Rate Decision
• US Employment Data (NFP)
• Global liquidity conditions
These events can create high-impact volatility spikes in BTC.
🔗 Correlated Markets to Watch
Monitoring related markets helps confirm trade direction.
💲 Crypto Market Pairs
• BTC/USDT – Primary market structure
• ETH/USDT – Ethereum momentum confirmation
• TOTAL Crypto Market Cap – Institutional flow indicator
📉 Macro Correlation Assets
• DXY (US Dollar Index) → Strong dollar may pressure BTC
• NASDAQ / US100 → Risk-on sentiment boosts crypto
• Gold (XAU/USD) → Competes as alternative store of value
💡 When NASDAQ rises and DXY falls, Bitcoin tends to perform strongly.
📊 Technical Observations
Key structural observations from the chart:
• Liquidity resting above recent highs
• Moving average resistance cluster
• Possible trap formation near overbought conditions
• Institutional accumulation below key support zones
This environment often creates fake breakouts before real moves.
Patience is a trader’s edge.
🧠 Professional Trading Reminder
Markets reward discipline, patience, and risk control.
Never chase price.
Let the market come to your plan.
💎 Thief Trader Mindset
“Liquidity is the real treasure.
Smart traders don't chase price —
they wait where the money hides.”
and
“The market doesn't reward speed.
It rewards patience and precision.”
👍 If you find this analysis helpful:
• Hit Boost 🚀
• Drop a Like 👍
• Share your market view in the comments
Let's grow together in the markets.
Crypto Market Profit Pathway Setup | Day / Swing Trade
Asset: BTC/USDT — Bitcoin vs Tether
Market: Cryptocurrency
Trading Style: Day / Swing Trade
Directional Bias: 📈 Bullish Plan
🧭 Trade Plan Overview
Bitcoin continues to show institutional accumulation signals after defending major demand zones. Market structure suggests that liquidity is being built for a potential continuation move.
This setup focuses on trend continuation with volatility expansion after consolidation.
Entry:
Traders may consider entries based on their own preferred price level, confirmation candle, or liquidity sweep setup.
⚠️ Always wait for confirmation from your own strategy.
🎯 Target Projection
Primary Target: $74,000
Reasons behind the target zone:
• The moving average cluster above price often acts like a “market police force,” creating strong resistance zones.
• Current structure indicates a possible liquidity trap for late buyers near resistance.
• Correlation signals suggest the market may push toward liquidity above recent highs before distribution.
💡 Smart traders may scale profits around liquidity pools near the 74K zone.
🛑 Risk Management
Stop Loss (Thief SL): $65,000
This level represents a structural invalidation zone where bullish market structure would weaken.
⚠️ Important note:
This stop loss is only part of the analysis idea. Risk management is always your personal decision.
Trade smart. Protect capital first.
🌐 Macro & Fundamental Drivers (Latest Market Context)
Several macroeconomic and geopolitical factors are currently influencing Bitcoin price behavior:
🏦 Federal Reserve Policy
Interest rate expectations and liquidity conditions remain the largest macro drivers for crypto markets. If inflation remains elevated, tighter monetary policy may limit Bitcoin’s upside.
💵 US Dollar Index (DXY)
Bitcoin often moves inversely to the U.S. Dollar Index. When the dollar strengthens, crypto assets tend to face downward pressure.
📊 Risk-Asset Correlation
Bitcoin frequently behaves like a high-beta risk asset similar to tech stocks, showing correlation with major indices like Nasdaq during liquidity cycles.
🌍 Geopolitical & Macro Volatility
Recent geopolitical tensions and macro uncertainty have increased volatility, while Bitcoin recently pushed toward the $73K–$74K area during risk-on sentiment shifts.
📅 Upcoming Economic Catalysts
Watch these macro events carefully:
• US CPI Inflation Data
• Federal Reserve Rate Decision
• US Employment Data (NFP)
• Global liquidity conditions
These events can create high-impact volatility spikes in BTC.
🔗 Correlated Markets to Watch
Monitoring related markets helps confirm trade direction.
💲 Crypto Market Pairs
• BTC/USDT – Primary market structure
• ETH/USDT – Ethereum momentum confirmation
• TOTAL Crypto Market Cap – Institutional flow indicator
📉 Macro Correlation Assets
• DXY (US Dollar Index) → Strong dollar may pressure BTC
• NASDAQ / US100 → Risk-on sentiment boosts crypto
• Gold (XAU/USD) → Competes as alternative store of value
💡 When NASDAQ rises and DXY falls, Bitcoin tends to perform strongly.
📊 Technical Observations
Key structural observations from the chart:
• Liquidity resting above recent highs
• Moving average resistance cluster
• Possible trap formation near overbought conditions
• Institutional accumulation below key support zones
This environment often creates fake breakouts before real moves.
Patience is a trader’s edge.
🧠 Professional Trading Reminder
Markets reward discipline, patience, and risk control.
Never chase price.
Let the market come to your plan.
💎 Thief Trader Mindset
“Liquidity is the real treasure.
Smart traders don't chase price —
they wait where the money hides.”
and
“The market doesn't reward speed.
It rewards patience and precision.”
👍 If you find this analysis helpful:
• Hit Boost 🚀
• Drop a Like 👍
• Share your market view in the comments
Let's grow together in the markets.

Wyłączenie odpowiedzialności
Informacje i publikacje nie stanowią i nie powinny być traktowane jako porady finansowe, inwestycyjne, tradingowe ani jakiekolwiek inne rekomendacje dostarczane lub zatwierdzone przez TradingView. Więcej informacji znajduje się w Warunkach użytkowania.
Wyłączenie odpowiedzialności
Informacje i publikacje nie stanowią i nie powinny być traktowane jako porady finansowe, inwestycyjne, tradingowe ani jakiekolwiek inne rekomendacje dostarczane lub zatwierdzone przez TradingView. Więcej informacji znajduje się w Warunkach użytkowania.