
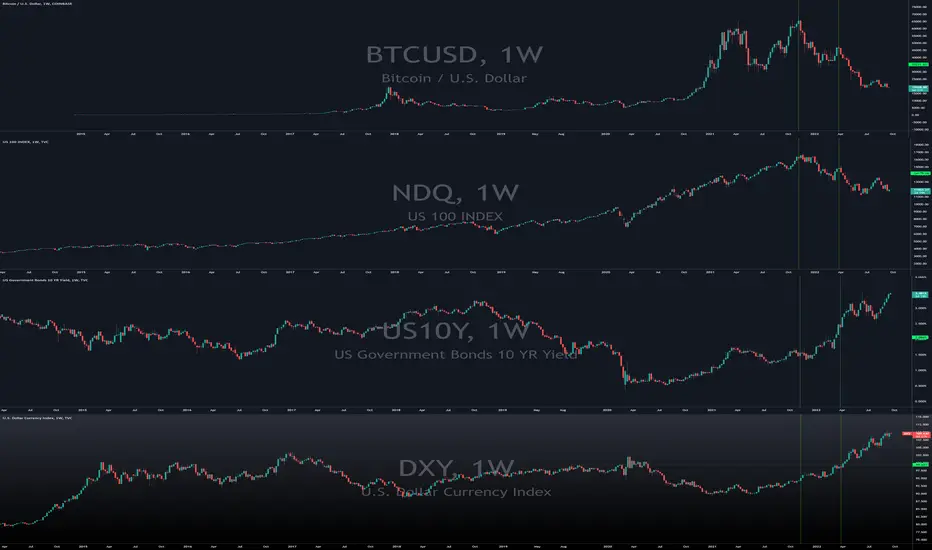
1st Vertical Line in bottom two charts show risk assets peaking such as Nasdaq and Bitcoin while the top two charts suggest a bottom confirmation by both US dollar and US 10 year treasury bills.
Horizontal line shows major penetration of support and/or resistance for all four charts. Penetration to the upside for top 2 charts, while penetration to the downside for risk assets.
2nd vertical line marks the point of penetration for support and/or resistance.
Why the strong correlation?
Market rotation from risk to safety and there's no other way to buy US treasury bills than to pay with US dollars.
Horizontal line shows major penetration of support and/or resistance for all four charts. Penetration to the upside for top 2 charts, while penetration to the downside for risk assets.
2nd vertical line marks the point of penetration for support and/or resistance.
Why the strong correlation?
Market rotation from risk to safety and there's no other way to buy US treasury bills than to pay with US dollars.

Wyłączenie odpowiedzialności
Informacje i publikacje nie stanowią i nie powinny być traktowane jako porady finansowe, inwestycyjne, tradingowe ani jakiekolwiek inne rekomendacje dostarczane lub zatwierdzone przez TradingView. Więcej informacji znajduje się w Warunkach użytkowania.
Wyłączenie odpowiedzialności
Informacje i publikacje nie stanowią i nie powinny być traktowane jako porady finansowe, inwestycyjne, tradingowe ani jakiekolwiek inne rekomendacje dostarczane lub zatwierdzone przez TradingView. Więcej informacji znajduje się w Warunkach użytkowania.