
#Btc | #Analyse | 1D | #NUM_A24
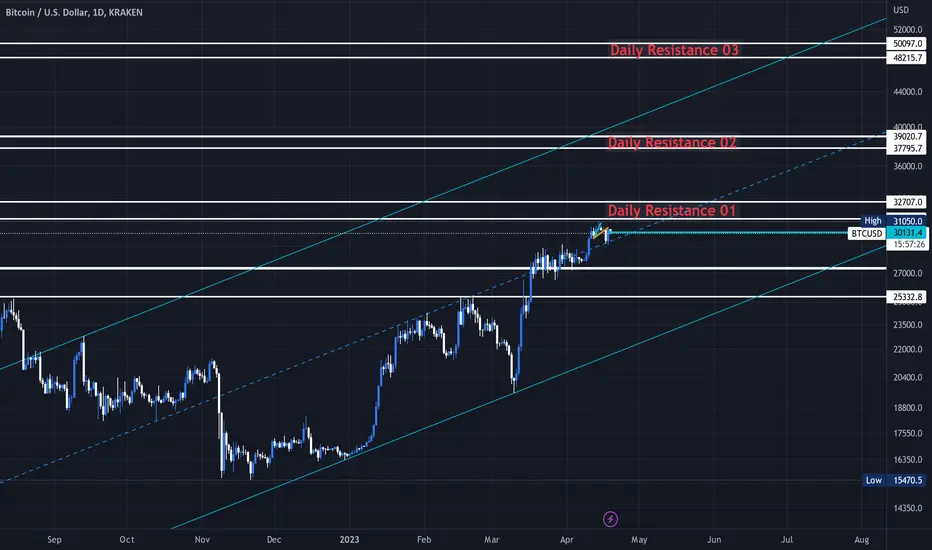
Bitcoin is in a bullish channel on the daily time frame
Currently, the midline of the support channel and a strong daily static resistance is located in the region of 32707~31245.
The daily momentum is upward and the trend is also upward
As we said in the previous analysis
If the price rises to the resistance areas that we specified in the chart, you can look for sales setups

Wyłączenie odpowiedzialności
Informacje i publikacje nie stanowią i nie powinny być traktowane jako porady finansowe, inwestycyjne, tradingowe ani jakiekolwiek inne rekomendacje dostarczane lub zatwierdzone przez TradingView. Więcej informacji znajduje się w Warunkach użytkowania.
Wyłączenie odpowiedzialności
Informacje i publikacje nie stanowią i nie powinny być traktowane jako porady finansowe, inwestycyjne, tradingowe ani jakiekolwiek inne rekomendacje dostarczane lub zatwierdzone przez TradingView. Więcej informacji znajduje się w Warunkach użytkowania.