
I am still not convinced...
Let me start by saying that I am the biggest bull, perma-bull, moonboy, lambo whatever or whatnot.
I am a strong Bitcoin supporter, fan, holder, promoter and everything 'YES Bitcoin!'
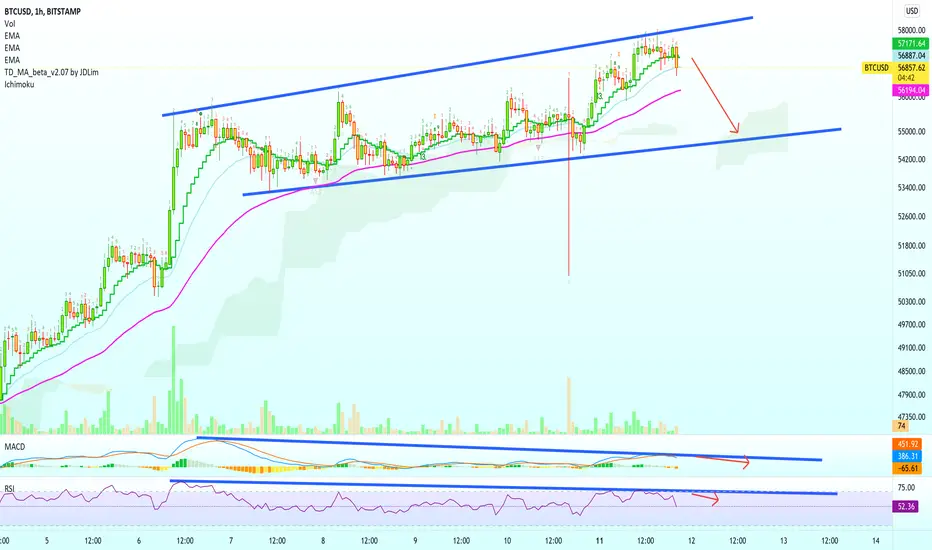
This last jump looks like a bear trap and Bitcoin might be ready to drop... Let's have a look at the signals:
1) Ethereum has been leading Bitcoin for quite a while but this time remained behind. When red instead of green.
2) See the MACD on this timeframe. Very strong bearish divergence, a strong bearish cross while trending lower:
3) Same with the RSI; bearish divergence. When we get this signal on both indicators it is stronger:
4) The current active candle is trading below EMA10 and EMA21.
This is a short-term analysis...
I am all for the upside.
I am a big Bitcoin holder but it looks like anytime now we can see a drop.
Let me know your views in the comments section, I know you have something to have about this call.
Namaste.
Let me start by saying that I am the biggest bull, perma-bull, moonboy, lambo whatever or whatnot.
I am a strong Bitcoin supporter, fan, holder, promoter and everything 'YES Bitcoin!'
This last jump looks like a bear trap and Bitcoin might be ready to drop... Let's have a look at the signals:
1) Ethereum has been leading Bitcoin for quite a while but this time remained behind. When red instead of green.
2) See the MACD on this timeframe. Very strong bearish divergence, a strong bearish cross while trending lower:
3) Same with the RSI; bearish divergence. When we get this signal on both indicators it is stronger:
4) The current active candle is trading below EMA10 and EMA21.
This is a short-term analysis...
I am all for the upside.
I am a big Bitcoin holder but it looks like anytime now we can see a drop.
Let me know your views in the comments section, I know you have something to have about this call.
Namaste.
Uwaga
To be fair though to my beloved Bitcoin bulls, these bearish signals are only present at this very short-term timeframe, 1h/2h. The daily timeframe we are bullish above EMA10 and all other indicators.
EMA10 is at $53,550 daily.
The weekly timeframe is also above EMA10.
EMA10 weekly is set at $48965.
These bearish signals are available here short-term.
Don't lose the bigger picture/perspective.
Yet, we are still going lower.
PREPARE!
Thanks a lot for your continued support.
Uwaga
Boom! Checkout the new analysis... It is live now.Just click/tap my username to get it. alansantana

🔥 Get the FULL (4-in-1) PREMIUM PACKAGE 👇
t.me/lamatrades/4 (Since 2017)
✅ FREE PREMIUM trade-numbers (4-10X) 👇
t.me/masteranandatrades/9043
🚨 TOP Results May 2026 👇
t.me/masteranandatrades/8778
t.me/lamatrades/4 (Since 2017)
✅ FREE PREMIUM trade-numbers (4-10X) 👇
t.me/masteranandatrades/9043
🚨 TOP Results May 2026 👇
t.me/masteranandatrades/8778
Powiązane publikacje
Wyłączenie odpowiedzialności
Informacje i publikacje nie stanowią i nie powinny być traktowane jako porady finansowe, inwestycyjne, tradingowe ani jakiekolwiek inne rekomendacje dostarczane lub zatwierdzone przez TradingView. Więcej informacji znajduje się w Warunkach użytkowania.
🔥 Get the FULL (4-in-1) PREMIUM PACKAGE 👇
t.me/lamatrades/4 (Since 2017)
✅ FREE PREMIUM trade-numbers (4-10X) 👇
t.me/masteranandatrades/9043
🚨 TOP Results May 2026 👇
t.me/masteranandatrades/8778
t.me/lamatrades/4 (Since 2017)
✅ FREE PREMIUM trade-numbers (4-10X) 👇
t.me/masteranandatrades/9043
🚨 TOP Results May 2026 👇
t.me/masteranandatrades/8778
Powiązane publikacje
Wyłączenie odpowiedzialności
Informacje i publikacje nie stanowią i nie powinny być traktowane jako porady finansowe, inwestycyjne, tradingowe ani jakiekolwiek inne rekomendacje dostarczane lub zatwierdzone przez TradingView. Więcej informacji znajduje się w Warunkach użytkowania.