
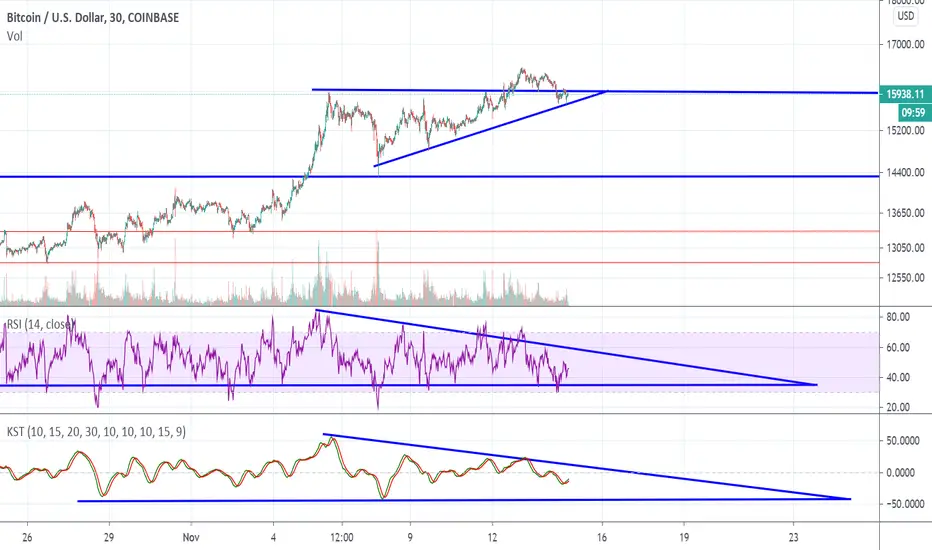
It appears as though Bitcoin has broken out of an Ascending Triangle to the upside, but was quickly rejected back into the pattern forming support on the upward blue sloping line of the Ascending Triangle.
Maybe a fake-out before moving higher, however, at the moment the blue horizontal line of the pattern is acting as resistance instead of turning into support when being back-tested.
On the RSI there's a descending triangle pattern that I mentioned in my previous post linked to this chart, the blue downward sloping line of resistance has been very consistent, the only divergence outside of the pattern coincides with the price of BTC breaking out of the ascending triangle.
On the KST there's a similar pattern, if we see Bitcoin continue to rise & there's another rejection on the RSI & KST at the blue downward sloping line it could get fugly, time will tell.
Maybe a fake-out before moving higher, however, at the moment the blue horizontal line of the pattern is acting as resistance instead of turning into support when being back-tested.
On the RSI there's a descending triangle pattern that I mentioned in my previous post linked to this chart, the blue downward sloping line of resistance has been very consistent, the only divergence outside of the pattern coincides with the price of BTC breaking out of the ascending triangle.
On the KST there's a similar pattern, if we see Bitcoin continue to rise & there's another rejection on the RSI & KST at the blue downward sloping line it could get fugly, time will tell.
Uwaga

Powiązane publikacje
Wyłączenie odpowiedzialności
Informacje i publikacje nie stanowią i nie powinny być traktowane jako porady finansowe, inwestycyjne, tradingowe ani jakiekolwiek inne rekomendacje dostarczane lub zatwierdzone przez TradingView. Więcej informacji znajduje się w Warunkach użytkowania.
Powiązane publikacje
Wyłączenie odpowiedzialności
Informacje i publikacje nie stanowią i nie powinny być traktowane jako porady finansowe, inwestycyjne, tradingowe ani jakiekolwiek inne rekomendacje dostarczane lub zatwierdzone przez TradingView. Więcej informacji znajduje się w Warunkach użytkowania.