
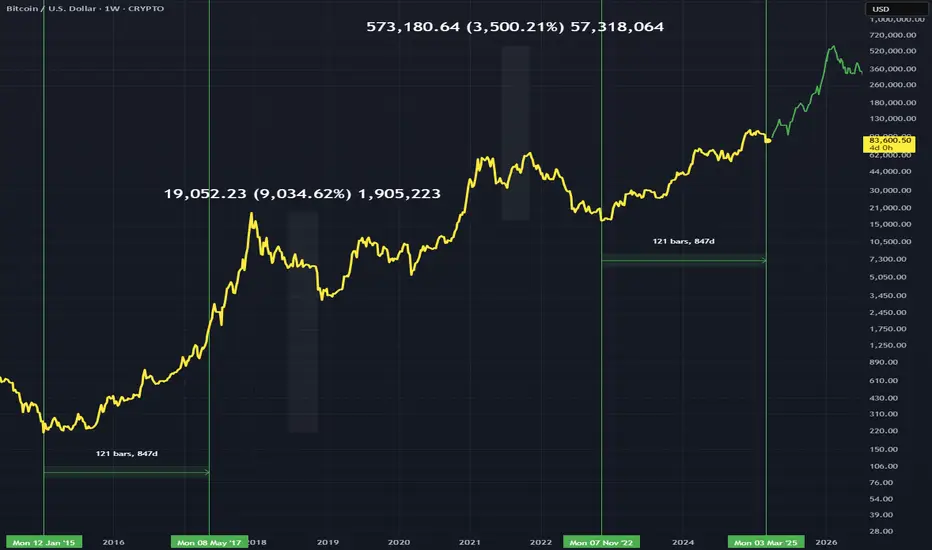
If we are experiencing a similar run to 2017 we would be 847days into the bull run
I have shown the bars pattern for where price could go with the rest of the time left, which shows a 3500% gain this bull market. This is compared to the 2017 run which was a 9000% gain to the top.
We have some bull time left is the take away if the runs are comparable.
Weekly chart.
I have shown the bars pattern for where price could go with the rest of the time left, which shows a 3500% gain this bull market. This is compared to the 2017 run which was a 9000% gain to the top.
We have some bull time left is the take away if the runs are comparable.
Weekly chart.

Wyłączenie odpowiedzialności
Informacje i publikacje nie stanowią i nie powinny być traktowane jako porady finansowe, inwestycyjne, tradingowe ani jakiekolwiek inne rekomendacje dostarczane lub zatwierdzone przez TradingView. Więcej informacji znajduje się w Warunkach użytkowania.
Wyłączenie odpowiedzialności
Informacje i publikacje nie stanowią i nie powinny być traktowane jako porady finansowe, inwestycyjne, tradingowe ani jakiekolwiek inne rekomendacje dostarczane lub zatwierdzone przez TradingView. Więcej informacji znajduje się w Warunkach użytkowania.