
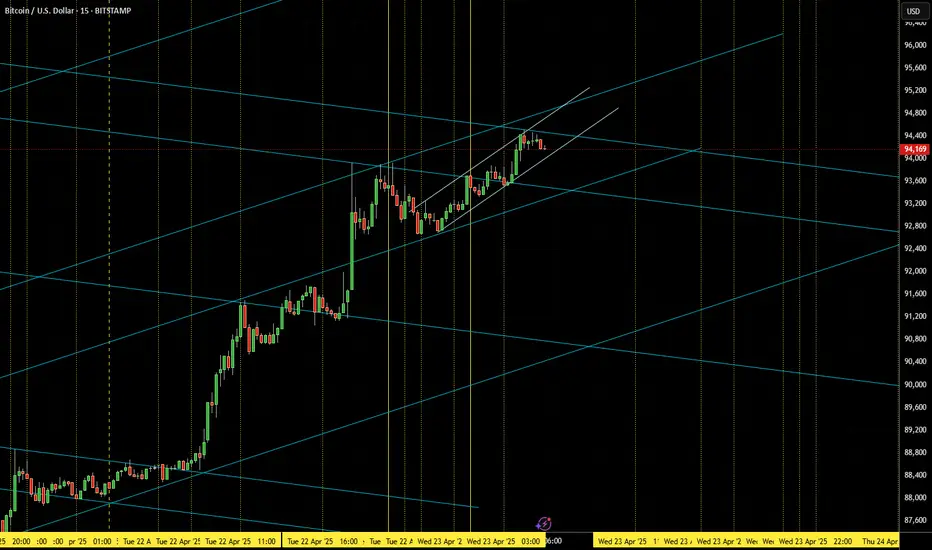
These are mathematically calculated cycle clusters based on hourly price and time data.
Cycle clusters can signal potential shifts in price action, including:
Bold vertical lines indicate periods where more cycles are clustered. Dashed lines reflect clusters with fewer overlapping cycles.
I've also added some charting work—mainly channels—to help visualize and potentially trade the price movement between clusters and between channel lines.
Questions are welcome!
Cycle clusters can signal potential shifts in price action, including:
- Changes in direction
- Momentum shifts (acceleration or deceleration)
- Breakouts
- Gaps
Bold vertical lines indicate periods where more cycles are clustered. Dashed lines reflect clusters with fewer overlapping cycles.
I've also added some charting work—mainly channels—to help visualize and potentially trade the price movement between clusters and between channel lines.
Questions are welcome!

Gonçalo Moreira
Sharing additional time-price scenarios through Telegram.
Sharing additional time-price scenarios through Telegram.
Wyłączenie odpowiedzialności
Informacje i publikacje nie stanowią i nie powinny być traktowane jako porady finansowe, inwestycyjne, tradingowe ani jakiekolwiek inne rekomendacje dostarczane lub zatwierdzone przez TradingView. Więcej informacji znajduje się w Warunkach użytkowania.
Gonçalo Moreira
Sharing additional time-price scenarios through Telegram.
Sharing additional time-price scenarios through Telegram.
Wyłączenie odpowiedzialności
Informacje i publikacje nie stanowią i nie powinny być traktowane jako porady finansowe, inwestycyjne, tradingowe ani jakiekolwiek inne rekomendacje dostarczane lub zatwierdzone przez TradingView. Więcej informacji znajduje się w Warunkach użytkowania.