
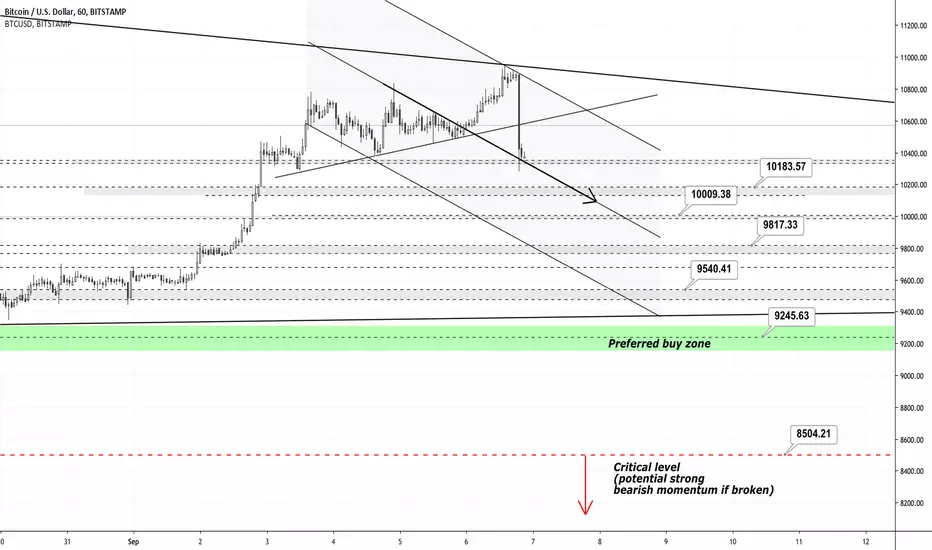
Those are the resistance areas formed by Fibonacci retracement, psychological prices, pivot points on large TF's and ichimoku lines.
While bearish on the short term, there is a bullish on the long term bias, expecting a future break to higher (out of chart) prices after going to 9,200$ (the lower part of the triangle.
8,500$ would invalidate the hypothesis and consolidate a bearish trend on the long term.
While bearish on the short term, there is a bullish on the long term bias, expecting a future break to higher (out of chart) prices after going to 9,200$ (the lower part of the triangle.
8,500$ would invalidate the hypothesis and consolidate a bearish trend on the long term.

Wyłączenie odpowiedzialności
Informacje i publikacje nie stanowią i nie powinny być traktowane jako porady finansowe, inwestycyjne, tradingowe ani jakiekolwiek inne rekomendacje dostarczane lub zatwierdzone przez TradingView. Więcej informacji znajduje się w Warunkach użytkowania.
Wyłączenie odpowiedzialności
Informacje i publikacje nie stanowią i nie powinny być traktowane jako porady finansowe, inwestycyjne, tradingowe ani jakiekolwiek inne rekomendacje dostarczane lub zatwierdzone przez TradingView. Więcej informacji znajduje się w Warunkach użytkowania.