
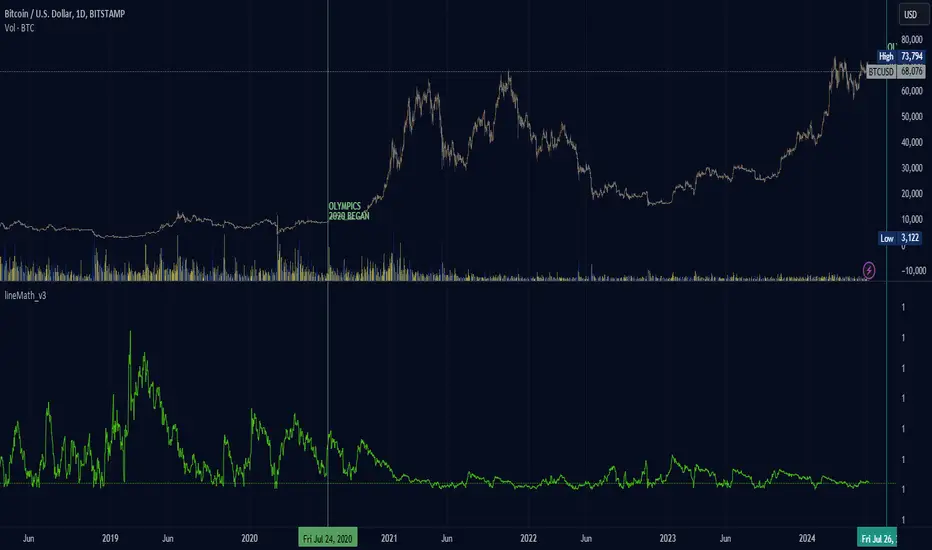
not sure what I created here; the indicator line shows slope information that leads before the price increases in the future. may have something to do with the halving and reduction in BTC. the green line decreases as the price grows in the same way a previous chart prices look smaller as the price reaches higher. the only difference here is that the graph lines are happening before the price of BTC peaks, odd. ...now I have to wait to see if the indicator line changes dramatically ahead of the price of BTC...

Wyłączenie odpowiedzialności
Informacje i publikacje nie stanowią i nie powinny być traktowane jako porady finansowe, inwestycyjne, tradingowe ani jakiekolwiek inne rekomendacje dostarczane lub zatwierdzone przez TradingView. Więcej informacji znajduje się w Warunkach użytkowania.
Wyłączenie odpowiedzialności
Informacje i publikacje nie stanowią i nie powinny być traktowane jako porady finansowe, inwestycyjne, tradingowe ani jakiekolwiek inne rekomendacje dostarczane lub zatwierdzone przez TradingView. Więcej informacji znajduje się w Warunkach użytkowania.