
Cycles are funny sometimes even when PA and results can be painful.
In a recent article by Bitcoin Magazine (May 21, 2026), Mark Cuban was cited as saying, “[he] has parted with most of his Bitcoin holdings, saying the asset failed to deliver on its core promise as a hedge against fiat currency weakness and geopolitical turmoil.”
Yet, the Financial Times on April 8 reported in an interview with Hamid Hosseini, a spokesperson for Iran’s Oil, Gas and Petrochemical Products Exporters’ Union that, “…oil vessels need to share inventory data with Iran and pay a $1 fee per barrel of oil in Bitcoin to be allowed safe passage through Hormuz; ’ Once the email arrives and Iran completes its assessment, vessels are given a few seconds to pay in Bitcoin, ensuring they can’t be traced or confiscated due to sanctions.’”
While Cuban insists that the crypto sector as a whole has failed to find mainstream utility because, “it hasn’t found an application for grandma,” it seems Iran has a different opinion of Bitcoin.
On a side note , that same Bitcoin Magazine article points out, “since the first signs of U.S.-Iran conflict emerged in late February, Bitcoin has risen more than 16% while gold has fallen over 15%.”
Food for thought.
Bitcoin PA High Time Frame (HTF) Analysis
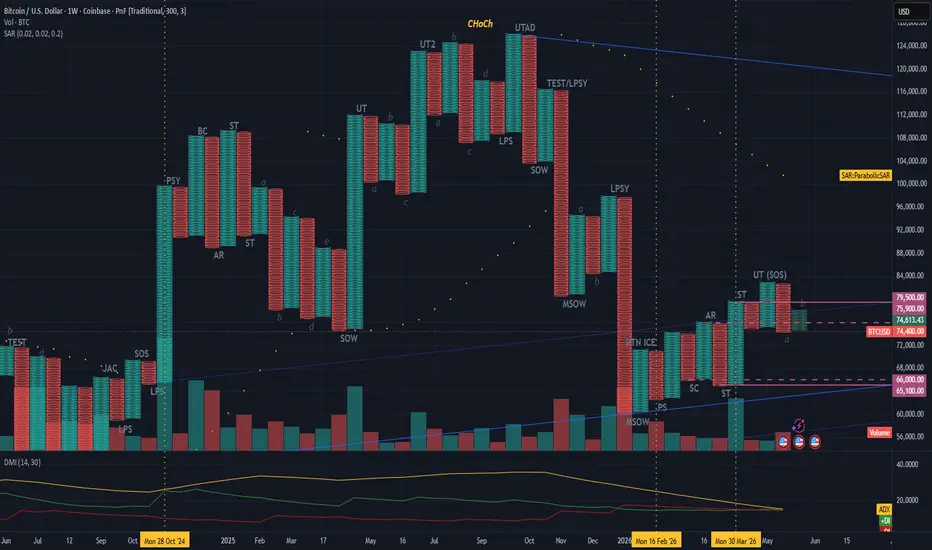
The High Time Frame (HTF) Point and Figure Chart (1W, Box Size 300, 3 Box Reversal), above illustrates after euphoria took Bitcoin PA into the stratosphere of a blow off top of $126,000 in early October 2025, the PA has been in successive Distribution waves through early February 2026.
Generally speaking, momentum in either direction follows a distinct pattern of three waves whose intensity increases at the completion of each cycle (for both accumulation and distribution).
Bitcoin PA Distribution Distribution Waves 1 thru 3
Momentum Shift from Distribution to Accumulation
Dramatic endings (even those that take months to resolve), signal a change of momentum. Following the dramatic Bitcoin PA fall to the $60,000 handle, Bitcoin PA has completed Phase A of a Wyckoff Accumulation Pattern, establishing a Trade Range with the ceiling at $79,500 and the floor at $65,100.
Bitcoin PA is currently in Stage B of that Wycoff Accumulation Pattern. It has currently retested the ceiling with an Upward Thrust (UT) earlier this month and is anticipated to retest the floor of this range over the next few weeks into June.
Key Price Handles
Two key price handles to watch are $65,100 (current price floor) and $63,800 (low of the current channel established by the Spring formed in Accumulation Wave 2 in August 2024 and retested by Distribution Wave 3 in January 2026).
Should $65,100 break, then $63,800 floor of the long-term trading channel is the next logical handle to anticipate.
Always remember this is not trading advice.
Outside of that, Happy Trading.
In a recent article by Bitcoin Magazine (May 21, 2026), Mark Cuban was cited as saying, “[he] has parted with most of his Bitcoin holdings, saying the asset failed to deliver on its core promise as a hedge against fiat currency weakness and geopolitical turmoil.”
Yet, the Financial Times on April 8 reported in an interview with Hamid Hosseini, a spokesperson for Iran’s Oil, Gas and Petrochemical Products Exporters’ Union that, “…oil vessels need to share inventory data with Iran and pay a $1 fee per barrel of oil in Bitcoin to be allowed safe passage through Hormuz; ’ Once the email arrives and Iran completes its assessment, vessels are given a few seconds to pay in Bitcoin, ensuring they can’t be traced or confiscated due to sanctions.’”
While Cuban insists that the crypto sector as a whole has failed to find mainstream utility because, “it hasn’t found an application for grandma,” it seems Iran has a different opinion of Bitcoin.
On a side note , that same Bitcoin Magazine article points out, “since the first signs of U.S.-Iran conflict emerged in late February, Bitcoin has risen more than 16% while gold has fallen over 15%.”
Food for thought.
Bitcoin PA High Time Frame (HTF) Analysis
The High Time Frame (HTF) Point and Figure Chart (1W, Box Size 300, 3 Box Reversal), above illustrates after euphoria took Bitcoin PA into the stratosphere of a blow off top of $126,000 in early October 2025, the PA has been in successive Distribution waves through early February 2026.
Generally speaking, momentum in either direction follows a distinct pattern of three waves whose intensity increases at the completion of each cycle (for both accumulation and distribution).
Bitcoin PA Distribution Distribution Waves 1 thru 3
- Distribution Wave 1 Sign of Weakness (SOW) established as Bitcoin PA touched $103,800 in October 2025 following the early September 2025 retest of the blow off top.
- Distribution Wave 2 Major Sign of Weakness (MSOW) established as Bitcoin PA touched $80,700 in November 2025, breaking through the floor of the trade range decisively with volume after Bitcoin failed to reclaim the Blow-Off Top high.
- Distribution Wave 3 Major Sign of Weakness (MSOW) established as Bitcoin PA broke through the floor of $80,700 established during Distribution Wave 2 with volume and touched $60,600 in early February 2026.
Momentum Shift from Distribution to Accumulation
Dramatic endings (even those that take months to resolve), signal a change of momentum. Following the dramatic Bitcoin PA fall to the $60,000 handle, Bitcoin PA has completed Phase A of a Wyckoff Accumulation Pattern, establishing a Trade Range with the ceiling at $79,500 and the floor at $65,100.
Bitcoin PA is currently in Stage B of that Wycoff Accumulation Pattern. It has currently retested the ceiling with an Upward Thrust (UT) earlier this month and is anticipated to retest the floor of this range over the next few weeks into June.
Key Price Handles
Two key price handles to watch are $65,100 (current price floor) and $63,800 (low of the current channel established by the Spring formed in Accumulation Wave 2 in August 2024 and retested by Distribution Wave 3 in January 2026).
Should $65,100 break, then $63,800 floor of the long-term trading channel is the next logical handle to anticipate.
Always remember this is not trading advice.
Outside of that, Happy Trading.

Wyłączenie odpowiedzialności
Informacje i publikacje nie stanowią i nie powinny być traktowane jako porady finansowe, inwestycyjne, tradingowe ani jakiekolwiek inne rekomendacje dostarczane lub zatwierdzone przez TradingView. Więcej informacji znajduje się w Warunkach użytkowania.
Wyłączenie odpowiedzialności
Informacje i publikacje nie stanowią i nie powinny być traktowane jako porady finansowe, inwestycyjne, tradingowe ani jakiekolwiek inne rekomendacje dostarczane lub zatwierdzone przez TradingView. Więcej informacji znajduje się w Warunkach użytkowania.