
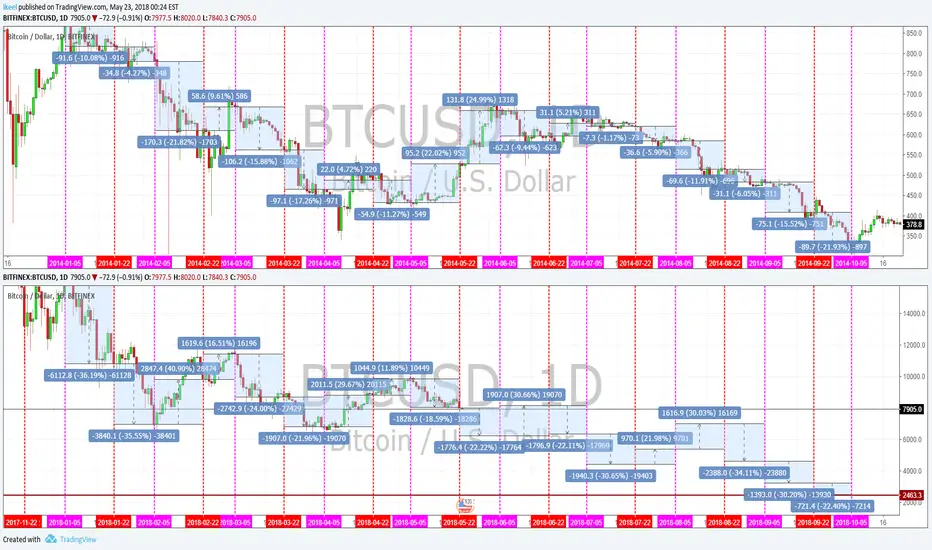
Here I compare price behavior in two types of intervals whilst comparing the 2014 & 2018 bear marketing starting from the new year.
Jan-Oct 2014 bear market:
Jan-Oct 2018 bear market:
Jan-Oct 2014 bear market:
- Red periods averaged 11.4% moves whilst Purple periods averaged 12.2% moves (from period candle close to close).
- Red periods saw twice as well downward moves, meanwhile Purple periods were 3.5x likely to be downward moves.
Jan-Oct 2018 bear market:
- Red periods averaged 22% moves whilst Purple periods averaged 30% moves (from period candle close to close).

Wyłączenie odpowiedzialności
Informacje i publikacje nie stanowią i nie powinny być traktowane jako porady finansowe, inwestycyjne, tradingowe ani jakiekolwiek inne rekomendacje dostarczane lub zatwierdzone przez TradingView. Więcej informacji znajduje się w Warunkach użytkowania.
Wyłączenie odpowiedzialności
Informacje i publikacje nie stanowią i nie powinny być traktowane jako porady finansowe, inwestycyjne, tradingowe ani jakiekolwiek inne rekomendacje dostarczane lub zatwierdzone przez TradingView. Więcej informacji znajduje się w Warunkach użytkowania.