
In a previous article I published on TradingView on May 6, I highlighted the importance of the US Clarity Act as a foundation for the next bullish cycle in Bitcoin’s price. The Clarity Act has now passed the US Senate Banking Committee stage and is expected to be adopted into law by the end of July. Negotiations are still ongoing between banks and crypto players, particularly regarding stablecoins and decentralized finance, in order to reach a final text and proceed to a full Senate vote.
The infographic below shows why the Clarity Act is a long-term bullish factor for Bitcoin and altcoins.

The Clarity Act will form the foundation of the next bull market; however, it does not guarantee that Bitcoin’s cyclical bear market is already over, especially as the price has just failed to break above its 200-day moving average, which historically acts as the boundary between bear and bull phases.
The chart below shows daily candlesticks for Bitcoin, highlighting the resistance role of the 200-day moving average.

After a rebound of more than 30% from its bottom at 60,000 US dollars in early February, Bitcoin price therefore failed (by just a few dollars) at its 200-day moving average. The bear market rally is over — what are the short-term technical prospects for BTC now?
Since mid-March, a “short squeeze” process has taken place in Bitcoin, driving the price from 60,000 US dollars up to 82,000 US dollars. Last week, Bitcoin tested its 200-day moving average almost exactly to the dollar, and it produced a bearish rejection similar to what occurred during previous cyclical bear markets. The technical pattern is therefore repeating itself, providing clarity for short-term outlooks. The 200-day moving average is widely used by institutional investors to assess the underlying trend of an asset. At this stage, it still has a downward slope for BTC, as shown in the chart above.
The 59K–70K$ zone as strong technical support
After this rejection below the 200-day moving average, how far could Bitcoin correct? The 59,000–70,000 US dollar zone is a strong support area: it corresponds to the previous cycle’s all-time high and also to the average production cost per Bitcoin.
The chart below shows weekly candlesticks for Bitcoin, including the average production cost band per BTC — a zone that has historically acted as a cyclical bottom and currently lies between 59,000 and 70,000 US dollars.

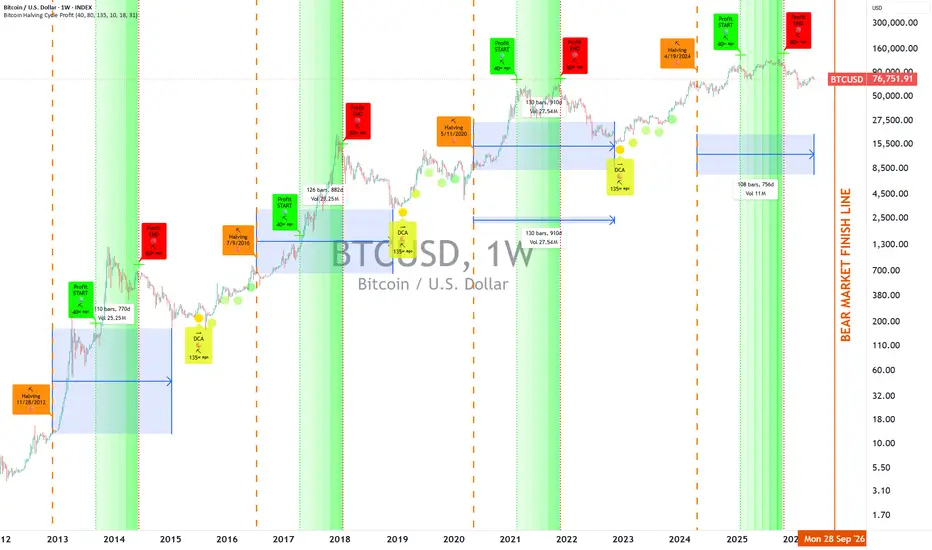
A break back above the 200-day moving average will signal the end of the cyclical bear market, and this signal is expected by the end of the year, consistent with the usual 4-year cycle rhythm.
The chart below illustrates the 4-year cycle theory for Bitcoin, with a final bottom expected in the second half of 2026, marking the end of the cyclical bear market and the resumption of the long-term uptrend.

DISCLAIMER:
This content is intended for individuals who are familiar with financial markets and instruments and is for information purposes only. The presented idea (including market commentary, market data and observations) is not a work product of any research department of Swissquote or its affiliates. This material is intended to highlight market action and does not constitute investment, legal or tax advice. If you are a retail investor or lack experience in trading complex financial products, it is advisable to seek professional advice from licensed advisor before making any financial decisions.
This content is not intended to manipulate the market or encourage any specific financial behavior.
Swissquote makes no representation or warranty as to the quality, completeness, accuracy, comprehensiveness or non-infringement of such content. The views expressed are those of the consultant and are provided for educational purposes only. Any information provided relating to a product or market should not be construed as recommending an investment strategy or transaction. Past performance is not a guarantee of future results.
Swissquote and its employees and representatives shall in no event be held liable for any damages or losses arising directly or indirectly from decisions made on the basis of this content.
The use of any third-party brands or trademarks is for information only and does not imply endorsement by Swissquote, or that the trademark owner has authorised Swissquote to promote its products or services.
Swissquote is the marketing brand for the activities of Swissquote Bank Ltd (Switzerland) regulated by FINMA, Swissquote Capital Markets Limited regulated by CySEC (Cyprus), Swissquote Bank Europe SA (Luxembourg) regulated by the CSSF, Swissquote Ltd (UK) regulated by the FCA, Swissquote Financial Services (Malta) Ltd regulated by the Malta Financial Services Authority, Swissquote MEA Ltd. (UAE) regulated by the Dubai Financial Services Authority, Swissquote Pte Ltd (Singapore) regulated by the Monetary Authority of Singapore, Swissquote Asia Limited (Hong Kong) licensed by the Hong Kong Securities and Futures Commission (SFC) and Swissquote South Africa (Pty) Ltd supervised by the FSCA.
Products and services of Swissquote are only intended for those permitted to receive them under local law.
All investments carry a degree of risk. The risk of loss in trading or holding financial instruments can be substantial. The value of financial instruments, including but not limited to stocks, bonds, cryptocurrencies, and other assets, can fluctuate both upwards and downwards. There is a significant risk of financial loss when buying, selling, holding, staking, or investing in these instruments. SQBE makes no recommendations regarding any specific investment, transaction, or the use of any particular investment strategy.
CFDs are complex instruments and come with a high risk of losing money rapidly due to leverage. The vast majority of retail client accounts suffer capital losses when trading in CFDs. You should consider whether you understand how CFDs work and whether you can afford to take the high risk of losing your money.
Digital Assets are unregulated in most countries and consumer protection rules may not apply. As highly volatile speculative investments, Digital Assets are not suitable for investors without a high-risk tolerance. Make sure you understand each Digital Asset before you trade.
Cryptocurrencies are not considered legal tender in some jurisdictions and are subject to regulatory uncertainties.
The use of Internet-based systems can involve high risks, including, but not limited to, fraud, cyber-attacks, network and communication failures, as well as identity theft and phishing attacks related to crypto-assets.
The infographic below shows why the Clarity Act is a long-term bullish factor for Bitcoin and altcoins.
The Clarity Act will form the foundation of the next bull market; however, it does not guarantee that Bitcoin’s cyclical bear market is already over, especially as the price has just failed to break above its 200-day moving average, which historically acts as the boundary between bear and bull phases.
The chart below shows daily candlesticks for Bitcoin, highlighting the resistance role of the 200-day moving average.
After a rebound of more than 30% from its bottom at 60,000 US dollars in early February, Bitcoin price therefore failed (by just a few dollars) at its 200-day moving average. The bear market rally is over — what are the short-term technical prospects for BTC now?
Since mid-March, a “short squeeze” process has taken place in Bitcoin, driving the price from 60,000 US dollars up to 82,000 US dollars. Last week, Bitcoin tested its 200-day moving average almost exactly to the dollar, and it produced a bearish rejection similar to what occurred during previous cyclical bear markets. The technical pattern is therefore repeating itself, providing clarity for short-term outlooks. The 200-day moving average is widely used by institutional investors to assess the underlying trend of an asset. At this stage, it still has a downward slope for BTC, as shown in the chart above.
The 59K–70K$ zone as strong technical support
After this rejection below the 200-day moving average, how far could Bitcoin correct? The 59,000–70,000 US dollar zone is a strong support area: it corresponds to the previous cycle’s all-time high and also to the average production cost per Bitcoin.
The chart below shows weekly candlesticks for Bitcoin, including the average production cost band per BTC — a zone that has historically acted as a cyclical bottom and currently lies between 59,000 and 70,000 US dollars.
A break back above the 200-day moving average will signal the end of the cyclical bear market, and this signal is expected by the end of the year, consistent with the usual 4-year cycle rhythm.
The chart below illustrates the 4-year cycle theory for Bitcoin, with a final bottom expected in the second half of 2026, marking the end of the cyclical bear market and the resumption of the long-term uptrend.
DISCLAIMER:
This content is intended for individuals who are familiar with financial markets and instruments and is for information purposes only. The presented idea (including market commentary, market data and observations) is not a work product of any research department of Swissquote or its affiliates. This material is intended to highlight market action and does not constitute investment, legal or tax advice. If you are a retail investor or lack experience in trading complex financial products, it is advisable to seek professional advice from licensed advisor before making any financial decisions.
This content is not intended to manipulate the market or encourage any specific financial behavior.
Swissquote makes no representation or warranty as to the quality, completeness, accuracy, comprehensiveness or non-infringement of such content. The views expressed are those of the consultant and are provided for educational purposes only. Any information provided relating to a product or market should not be construed as recommending an investment strategy or transaction. Past performance is not a guarantee of future results.
Swissquote and its employees and representatives shall in no event be held liable for any damages or losses arising directly or indirectly from decisions made on the basis of this content.
The use of any third-party brands or trademarks is for information only and does not imply endorsement by Swissquote, or that the trademark owner has authorised Swissquote to promote its products or services.
Swissquote is the marketing brand for the activities of Swissquote Bank Ltd (Switzerland) regulated by FINMA, Swissquote Capital Markets Limited regulated by CySEC (Cyprus), Swissquote Bank Europe SA (Luxembourg) regulated by the CSSF, Swissquote Ltd (UK) regulated by the FCA, Swissquote Financial Services (Malta) Ltd regulated by the Malta Financial Services Authority, Swissquote MEA Ltd. (UAE) regulated by the Dubai Financial Services Authority, Swissquote Pte Ltd (Singapore) regulated by the Monetary Authority of Singapore, Swissquote Asia Limited (Hong Kong) licensed by the Hong Kong Securities and Futures Commission (SFC) and Swissquote South Africa (Pty) Ltd supervised by the FSCA.
Products and services of Swissquote are only intended for those permitted to receive them under local law.
All investments carry a degree of risk. The risk of loss in trading or holding financial instruments can be substantial. The value of financial instruments, including but not limited to stocks, bonds, cryptocurrencies, and other assets, can fluctuate both upwards and downwards. There is a significant risk of financial loss when buying, selling, holding, staking, or investing in these instruments. SQBE makes no recommendations regarding any specific investment, transaction, or the use of any particular investment strategy.
CFDs are complex instruments and come with a high risk of losing money rapidly due to leverage. The vast majority of retail client accounts suffer capital losses when trading in CFDs. You should consider whether you understand how CFDs work and whether you can afford to take the high risk of losing your money.
Digital Assets are unregulated in most countries and consumer protection rules may not apply. As highly volatile speculative investments, Digital Assets are not suitable for investors without a high-risk tolerance. Make sure you understand each Digital Asset before you trade.
Cryptocurrencies are not considered legal tender in some jurisdictions and are subject to regulatory uncertainties.
The use of Internet-based systems can involve high risks, including, but not limited to, fraud, cyber-attacks, network and communication failures, as well as identity theft and phishing attacks related to crypto-assets.

This content is written by Vincent Ganne for Swissquote.
This content is intended for individuals who are familiar with financial markets and instruments and is for information purposes only and does not constitute investment, legal or tax advice.
This content is intended for individuals who are familiar with financial markets and instruments and is for information purposes only and does not constitute investment, legal or tax advice.
Powiązane publikacje
Wyłączenie odpowiedzialności
Informacje i publikacje nie stanowią i nie powinny być traktowane jako porady finansowe, inwestycyjne, tradingowe ani jakiekolwiek inne rekomendacje dostarczane lub zatwierdzone przez TradingView. Więcej informacji znajduje się w Warunkach użytkowania.
This content is written by Vincent Ganne for Swissquote.
This content is intended for individuals who are familiar with financial markets and instruments and is for information purposes only and does not constitute investment, legal or tax advice.
This content is intended for individuals who are familiar with financial markets and instruments and is for information purposes only and does not constitute investment, legal or tax advice.
Powiązane publikacje
Wyłączenie odpowiedzialności
Informacje i publikacje nie stanowią i nie powinny być traktowane jako porady finansowe, inwestycyjne, tradingowe ani jakiekolwiek inne rekomendacje dostarczane lub zatwierdzone przez TradingView. Więcej informacji znajduje się w Warunkach użytkowania.