
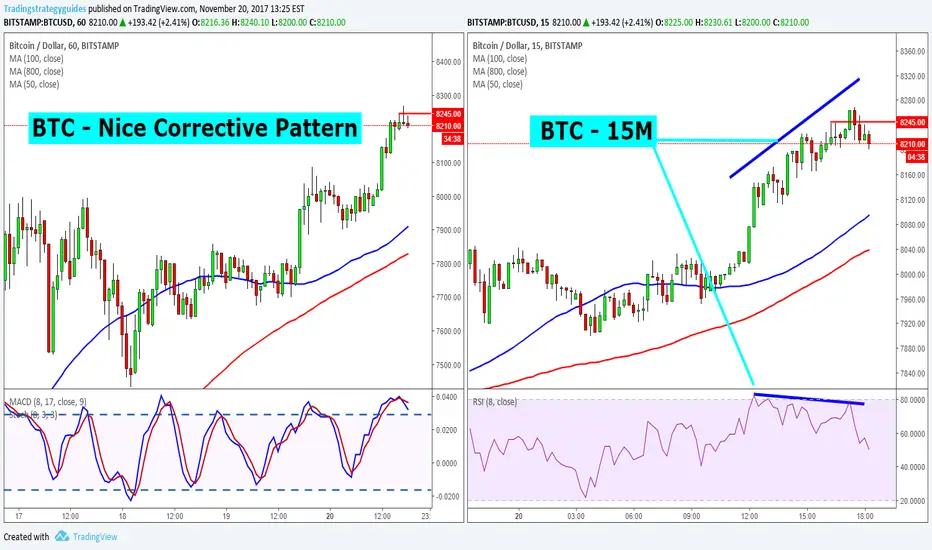
15m chart has divergence between price and RSI.
Remember, divergence can be seen by comparing price action and the movement of an indicator.
If the price is making higher highs, the oscillator should also be making higher highs. If price is making lower lows, the oscillator should also be making lower lows.
If they are not, that means price and the oscillator are diverging from each other.
Which is why it’s called “divergence.”
Just because you see a divergence, it doesn’t necessarily mean you should automatically jump in with a position.
Remember, divergence can be seen by comparing price action and the movement of an indicator.
If the price is making higher highs, the oscillator should also be making higher highs. If price is making lower lows, the oscillator should also be making lower lows.
If they are not, that means price and the oscillator are diverging from each other.
Which is why it’s called “divergence.”
Just because you see a divergence, it doesn’t necessarily mean you should automatically jump in with a position.

Wyłączenie odpowiedzialności
Informacje i publikacje nie stanowią i nie powinny być traktowane jako porady finansowe, inwestycyjne, tradingowe ani jakiekolwiek inne rekomendacje dostarczane lub zatwierdzone przez TradingView. Więcej informacji znajduje się w Warunkach użytkowania.
Wyłączenie odpowiedzialności
Informacje i publikacje nie stanowią i nie powinny być traktowane jako porady finansowe, inwestycyjne, tradingowe ani jakiekolwiek inne rekomendacje dostarczane lub zatwierdzone przez TradingView. Więcej informacji znajduje się w Warunkach użytkowania.