
✨ Market Overview
BTC is currently in a consolidation phase following recent fluctuations. Although the price has fallen slightly by 0.87% in the past 24 hours the medium-term trend remains upward with a 3.67% increase in 7 days and a 12.28% increase in 30 days. The market is in an adjustment period affected by geopolitical situations and Federal Reserve policies but ETF capital inflows and institutional holdings continue to provide strong support for BTC prices.
🎯 Key Levels
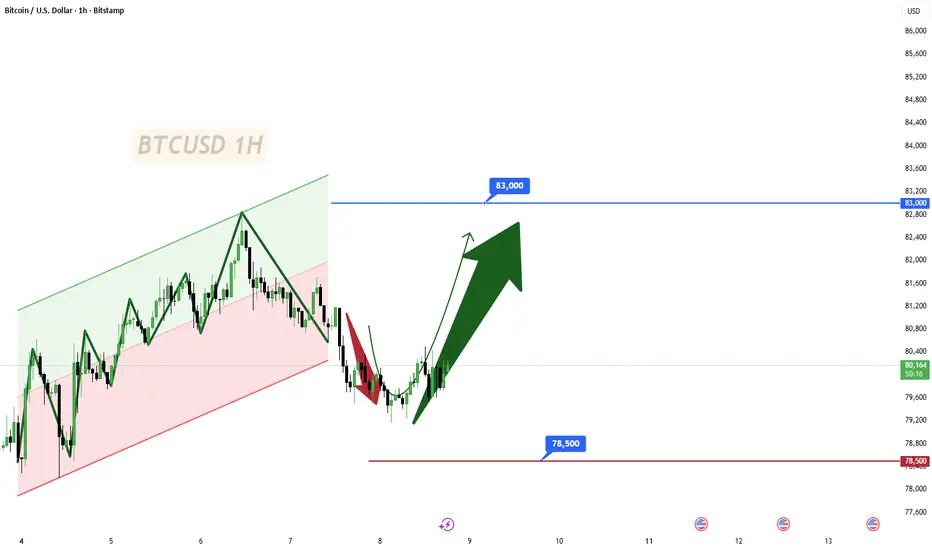
Resistance Zones: 81800-84300 90000 (the primary medium-term resistance level serving as a key psychological and technical barrier with significant profit-taking pressure)
Support Zones: 79000-79500 (a critical support range and market direction watershed) 75000 (the primary support level with strong demand and institutional accumulation)
✨ Technical Outlook
The daily chart of BTC shows a top formation composed of shooting stars and large bearish candles while the 15-minute chart presents a downward continuation pattern. The 4-hour RSI indicator is in a downward trend KDJ forms a death cross and MACD shows a contraction in bearish momentum. The current correction is a healthy adjustment in the medium-term upward trend if the price breaks below the 79000 support level it may trigger further declines and profit-taking.
💡 Trading Strategy
1. Pullback Buying: Enter the market in the 79000-79500 range set stop-loss below 78500 with the first target at 81800 and the second target at 84300.
2. Avoid chasing highs; focus on support zone entry opportunities. Adopt a DCA strategy during extreme market panic periods to reduce trading risks.
🔍 Summary
The medium-term upward trend of BTC remains intact supported by institutional capital inflows ETF capital inflows and market institutionalization transformation. Pay attention to short-term pressures from Federal Reserve policies and geopolitics focus on the 79000 support zone and adjust trading strategies based on actual price movements and technical signals to avoid excessive leverage risks.
BTC is currently in a consolidation phase following recent fluctuations. Although the price has fallen slightly by 0.87% in the past 24 hours the medium-term trend remains upward with a 3.67% increase in 7 days and a 12.28% increase in 30 days. The market is in an adjustment period affected by geopolitical situations and Federal Reserve policies but ETF capital inflows and institutional holdings continue to provide strong support for BTC prices.
🎯 Key Levels
Resistance Zones: 81800-84300 90000 (the primary medium-term resistance level serving as a key psychological and technical barrier with significant profit-taking pressure)
Support Zones: 79000-79500 (a critical support range and market direction watershed) 75000 (the primary support level with strong demand and institutional accumulation)
✨ Technical Outlook
The daily chart of BTC shows a top formation composed of shooting stars and large bearish candles while the 15-minute chart presents a downward continuation pattern. The 4-hour RSI indicator is in a downward trend KDJ forms a death cross and MACD shows a contraction in bearish momentum. The current correction is a healthy adjustment in the medium-term upward trend if the price breaks below the 79000 support level it may trigger further declines and profit-taking.
💡 Trading Strategy
1. Pullback Buying: Enter the market in the 79000-79500 range set stop-loss below 78500 with the first target at 81800 and the second target at 84300.
2. Avoid chasing highs; focus on support zone entry opportunities. Adopt a DCA strategy during extreme market panic periods to reduce trading risks.
🔍 Summary
The medium-term upward trend of BTC remains intact supported by institutional capital inflows ETF capital inflows and market institutionalization transformation. Pay attention to short-term pressures from Federal Reserve policies and geopolitics focus on the 79000 support zone and adjust trading strategies based on actual price movements and technical signals to avoid excessive leverage risks.
Zlecenie aktywne
Transakcja zamknięta: osiągnięto wyznaczony cel

Wyłączenie odpowiedzialności
Informacje i publikacje nie stanowią i nie powinny być traktowane jako porady finansowe, inwestycyjne, tradingowe ani jakiekolwiek inne rekomendacje dostarczane lub zatwierdzone przez TradingView. Więcej informacji znajduje się w Warunkach użytkowania.
Wyłączenie odpowiedzialności
Informacje i publikacje nie stanowią i nie powinny być traktowane jako porady finansowe, inwestycyjne, tradingowe ani jakiekolwiek inne rekomendacje dostarczane lub zatwierdzone przez TradingView. Więcej informacji znajduje się w Warunkach użytkowania.