
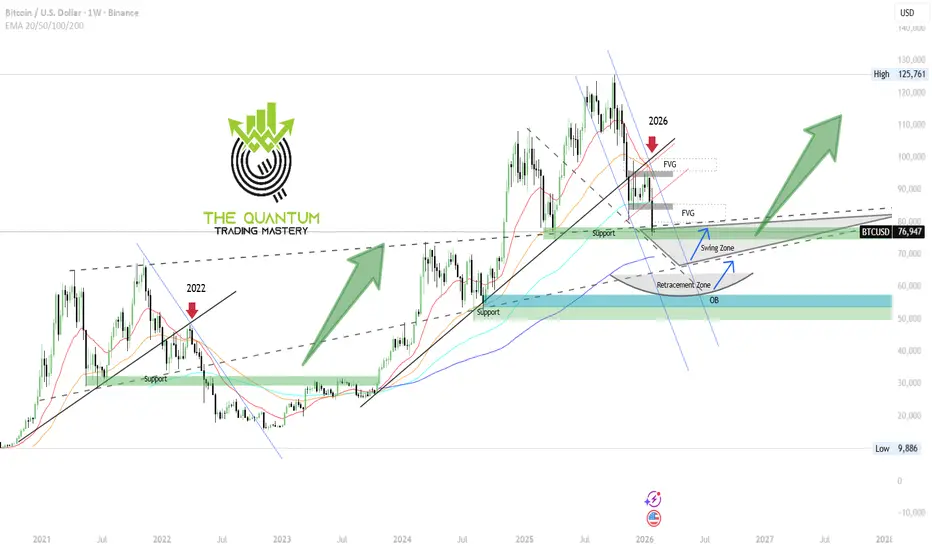
Weekly Timeframe (Macro Bias & Swing Context)
On 17 December 2025, I shared the BTC weekly chart and clearly outlined what was likely to unfold. Congratulations to those who followed the analysis.
Price is mirroring the 2022 breakout pattern → expecting accumulation and breakout by mid-2025, with 2026 as a potential cycle expansion phase.
I’ve now updated the BTC weekly chart with additional confluences, highlighting two key upcoming support zones:
Swing Zone (liquidity Sweep possibilities): 65k – 68k
Retracement Zone: 56k – 60k
Comparison: 2022 vs 2026 setups
The 2022 structure marked on chart shows BTC breaking out from a falling trendline post large retracement, leading to multi-month rally.
The 2026 comparative zone mimics that exact setup — short-term liquidity sweep below support, confluence with OB + retracement zone, then structural breakout.
Key Observations
Trend Bias: Bullish macro cycle — higher highs and higher lows.
Structure: Re-Accumulation phase above 50W EMA & long-term ascending trendline.
Important Levels:
Demand / OB Zone: 55K–60K
Strong Support: 70K–73K
Resistance/FVG: 88K–92K → 110K–125K
Weekly Bias:
→ Bullish Re-Accumulation.
→ Enter dips near 70K–73K; accumulate for 90K+ breakout.
Weekly Swing Route Map
Entry: On Retrace Zone to 68K–73K OR breakout close above 80K.
Stop Loss: Below 65K (key structural invalidation).
Targets:
TP1 = 90K (FVG fill)
TP2 = 110K+ (cycle expansion zone)
Hold Duration: 2–8 weeks.
Integrated Setup (Multi Time Frame)
Example
1️⃣ On 4H: Look for a liquidity sweep under 75K (fake out wick) and bullish engulfing to close back above 75.5K.
→ Enter partial long with tight SL (74.5K).
2️⃣ On 1D: Add position when daily candle closes above 78K (bullish structure confirmation).
3️⃣ On 1W: If weekly closes strong >$80K, hold remaining position for macro target 90K–110K.
Trade with cautious. Trade is involved RISKs. This is not a trading Signal, its pure technical analysis based on many confluences marked.
Follow our page for more updates on GOLD, NASDAQ and BTC
The Quantum Trading Mastery
On 17 December 2025, I shared the BTC weekly chart and clearly outlined what was likely to unfold. Congratulations to those who followed the analysis.
Price is mirroring the 2022 breakout pattern → expecting accumulation and breakout by mid-2025, with 2026 as a potential cycle expansion phase.
I’ve now updated the BTC weekly chart with additional confluences, highlighting two key upcoming support zones:
Swing Zone (liquidity Sweep possibilities): 65k – 68k
Retracement Zone: 56k – 60k
Comparison: 2022 vs 2026 setups
The 2022 structure marked on chart shows BTC breaking out from a falling trendline post large retracement, leading to multi-month rally.
The 2026 comparative zone mimics that exact setup — short-term liquidity sweep below support, confluence with OB + retracement zone, then structural breakout.
Key Observations
Trend Bias: Bullish macro cycle — higher highs and higher lows.
Structure: Re-Accumulation phase above 50W EMA & long-term ascending trendline.
Important Levels:
Demand / OB Zone: 55K–60K
Strong Support: 70K–73K
Resistance/FVG: 88K–92K → 110K–125K
Weekly Bias:
→ Bullish Re-Accumulation.
→ Enter dips near 70K–73K; accumulate for 90K+ breakout.
Weekly Swing Route Map
Entry: On Retrace Zone to 68K–73K OR breakout close above 80K.
Stop Loss: Below 65K (key structural invalidation).
Targets:
TP1 = 90K (FVG fill)
TP2 = 110K+ (cycle expansion zone)
Hold Duration: 2–8 weeks.
Integrated Setup (Multi Time Frame)
Example
1️⃣ On 4H: Look for a liquidity sweep under 75K (fake out wick) and bullish engulfing to close back above 75.5K.
→ Enter partial long with tight SL (74.5K).
2️⃣ On 1D: Add position when daily candle closes above 78K (bullish structure confirmation).
3️⃣ On 1W: If weekly closes strong >$80K, hold remaining position for macro target 90K–110K.
Trade with cautious. Trade is involved RISKs. This is not a trading Signal, its pure technical analysis based on many confluences marked.
Follow our page for more updates on GOLD, NASDAQ and BTC
The Quantum Trading Mastery
Zlecenie aktywne
BTC successfully reached Swing Zone & Retracement Zone. Now we will wait for the weekly candle and daily candle to close. Next week on Monday is a big week for BTC. I will advice either its good to Enter Bullish or Wait for further confirmation. Transakcja zamknięta: osiągnięto wyznaczony cel
BTC Target Reached at Retracement Zone. Wait for further confirmation and follow us for more updates. 
Powiązane publikacje
Wyłączenie odpowiedzialności
Informacje i publikacje nie stanowią i nie powinny być traktowane jako porady finansowe, inwestycyjne, tradingowe ani jakiekolwiek inne rekomendacje dostarczane lub zatwierdzone przez TradingView. Więcej informacji znajduje się w Warunkach użytkowania.
Powiązane publikacje
Wyłączenie odpowiedzialności
Informacje i publikacje nie stanowią i nie powinny być traktowane jako porady finansowe, inwestycyjne, tradingowe ani jakiekolwiek inne rekomendacje dostarczane lub zatwierdzone przez TradingView. Więcej informacji znajduje się w Warunkach użytkowania.