
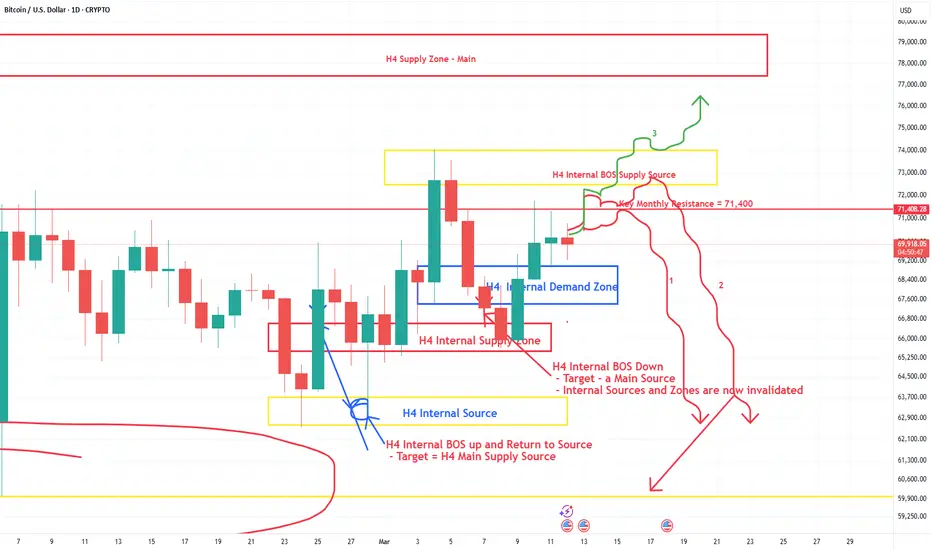
Hey, Traders. Time to take another look at Bitcoin and see what the market is telling us. If you've been following, you know we have a structural way to READ what the chart is telling us and how to respond according. Right now, BTC is just noise and a trap for anyone trying to guess what it is doing. The way the market has been moving up and down is all part of a structural plan being played out clearly. Take a look at our last post from Jan 24 to see how and why the price fell from 89K then to $59,900. This was a near perfect set up for those with EYES to SEE, and that same structure is still in place now.
So, Where are we Now?:
Here's what I SEE...after falling to the $59,900 Weekly Source we identified, BTC almost immediately sprang back up. NOTE: This is NOT a rebound and Bitcoin is still bearish. These are just key structural levels that are being tested to see if it can attempt to break out of the bearish flow. The Main one of these is a Key Monthly level at 71,400. Until we get a Daily Candle to close above that and stay above it...Bitcoin will continue to fall. This area was tested a few times and has been rejected each time. We did have one daily close above it on March 4, but it too was immediately rejected with a bear push back below it the next day.
So, What is next?:
Keep in mind that regardless of wars, news events, Fed Rates, etc. that are literally ALL noise designed to confuse Retail Traders and Investors...the Charts Don't Lie! We need to READ what BTC is doing and follow that!. At this point, there are 3 possible scenarios (2 bearish, 1 bullish) that I can see that will play out from here and the H4 Timeframe is the first signal that will determine which one we will ultimately see:
1. We get another push back up that Rejects $71,400 AGAIN and confirms that we're not close to being bullish. This would lead to a fall back to at least the H4 Internal Source of 62-64K to possibly try to regain strength.
2. We see a break above 71,400 but it still gets rejected at the H4 Internal BOS Source around 73-74K. Surprisingly, this is an even stronger case for it falling back to 62-64K...or back to 59,900 to retest a Weekly Structure.
3. The only significant bullish case is a close above 71,400...followed by a close above 74,100. That would be the first bullish signal we have had in Months! So, if that happens, BTC buyers can feel better. NOTE: There is still the Main H4 Supply Zone at ~$77.5 - 79K that is the Primary Structure keeping things bearish, so even if we see a break into the 74K area, expect another BIG SLAP of resistance at 77K.
So, overall...we're playing around mostly for now and heading into dangerous territory, and again...all this momentum is one big trap for buyers who will be "exit liquidity" if they are not aware of what is happening.
As always, hope this was valuable, and look forward to seeing your comments or questions. If you need help in learning to analyze the markets, let us know, and we'd be glad to get in touch with you. Happy Trading!!!
So, Where are we Now?:
Here's what I SEE...after falling to the $59,900 Weekly Source we identified, BTC almost immediately sprang back up. NOTE: This is NOT a rebound and Bitcoin is still bearish. These are just key structural levels that are being tested to see if it can attempt to break out of the bearish flow. The Main one of these is a Key Monthly level at 71,400. Until we get a Daily Candle to close above that and stay above it...Bitcoin will continue to fall. This area was tested a few times and has been rejected each time. We did have one daily close above it on March 4, but it too was immediately rejected with a bear push back below it the next day.
So, What is next?:
Keep in mind that regardless of wars, news events, Fed Rates, etc. that are literally ALL noise designed to confuse Retail Traders and Investors...the Charts Don't Lie! We need to READ what BTC is doing and follow that!. At this point, there are 3 possible scenarios (2 bearish, 1 bullish) that I can see that will play out from here and the H4 Timeframe is the first signal that will determine which one we will ultimately see:
1. We get another push back up that Rejects $71,400 AGAIN and confirms that we're not close to being bullish. This would lead to a fall back to at least the H4 Internal Source of 62-64K to possibly try to regain strength.
2. We see a break above 71,400 but it still gets rejected at the H4 Internal BOS Source around 73-74K. Surprisingly, this is an even stronger case for it falling back to 62-64K...or back to 59,900 to retest a Weekly Structure.
3. The only significant bullish case is a close above 71,400...followed by a close above 74,100. That would be the first bullish signal we have had in Months! So, if that happens, BTC buyers can feel better. NOTE: There is still the Main H4 Supply Zone at ~$77.5 - 79K that is the Primary Structure keeping things bearish, so even if we see a break into the 74K area, expect another BIG SLAP of resistance at 77K.
So, overall...we're playing around mostly for now and heading into dangerous territory, and again...all this momentum is one big trap for buyers who will be "exit liquidity" if they are not aware of what is happening.
As always, hope this was valuable, and look forward to seeing your comments or questions. If you need help in learning to analyze the markets, let us know, and we'd be glad to get in touch with you. Happy Trading!!!
Uwaga
BTC has been playing out the #3 scenario and pushed all the way up to the Main H4 Supply Zone ( reached 76K vs. 77K). We got the expected SLAP back down and it is now testing the Internal H4 Demand Zone AGAIN. IF this zone holds, expect a push back up to once again try and break that H4 Supply Zone. REMEMBER, we are STILL BEARISH until that H4 Supply Zone breaks. An H4 close below this internal zone (close below 67.4K) is further validation of the fall back down to the 62K - 64K area, and possibly back to the Weekly Support of 59.9K again.
Zlecenie aktywne
As of Today, 3-22-26, BTC is back to retesting this Internal H4 Demand Zone. Technically at this point, this is between scenario 2 and 3. The close above the H4 Internal Supply Source ~ 74,100 was rejected and so this was invalidated. The price has pushed back down for either another try of #3, or #2 is what is actually playing out. This current zone will be the tell tell sign. A close below 67.4K will decide. 
Powiązane publikacje
Wyłączenie odpowiedzialności
Informacje i publikacje nie stanowią i nie powinny być traktowane jako porady finansowe, inwestycyjne, tradingowe ani jakiekolwiek inne rekomendacje dostarczane lub zatwierdzone przez TradingView. Więcej informacji znajduje się w Warunkach użytkowania.
Powiązane publikacje
Wyłączenie odpowiedzialności
Informacje i publikacje nie stanowią i nie powinny być traktowane jako porady finansowe, inwestycyjne, tradingowe ani jakiekolwiek inne rekomendacje dostarczane lub zatwierdzone przez TradingView. Więcej informacji znajduje się w Warunkach użytkowania.