
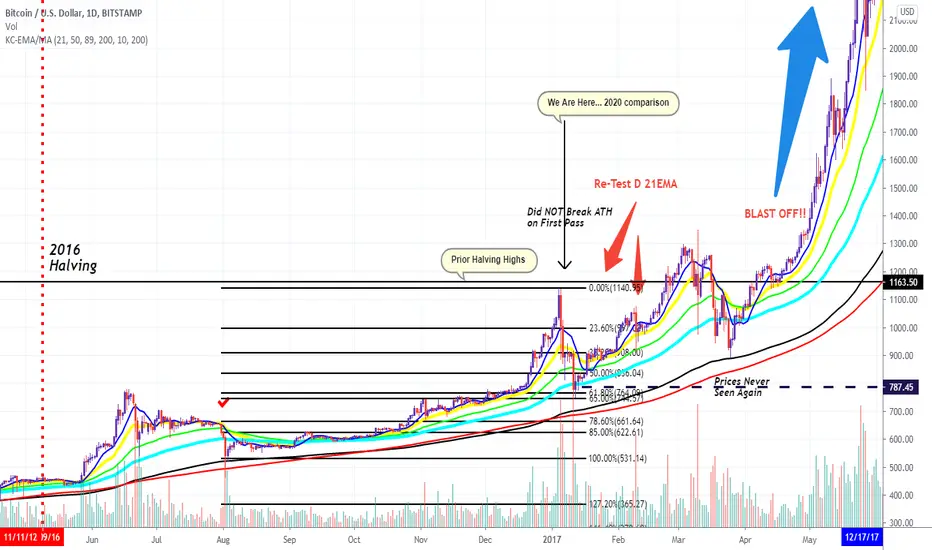
Retro Chart I've been posting and its hitting similarities in 2020. Just hit the Daily 21 EMA, might test the Daily 89 EMA...didn't test Weekly 21 EMA unitl January 2017, but by then...the Dip to the 21 Daily EMA was still Lower than the Januaru Dip...Prices Never Seen Again...
Uwaga
Thanks for all the Likes and comments, follow my feed and we'll refer to this chart for the next year adding to it and compare the past and current Bull Runs
Wyłączenie odpowiedzialności
Informacje i publikacje nie stanowią i nie powinny być traktowane jako porady finansowe, inwestycyjne, tradingowe ani jakiekolwiek inne rekomendacje dostarczane lub zatwierdzone przez TradingView. Więcej informacji znajduje się w Warunkach użytkowania.
Wyłączenie odpowiedzialności
Informacje i publikacje nie stanowią i nie powinny być traktowane jako porady finansowe, inwestycyjne, tradingowe ani jakiekolwiek inne rekomendacje dostarczane lub zatwierdzone przez TradingView. Więcej informacji znajduje się w Warunkach użytkowania.