
Generated: 2026-03-27 03:42 ET
Three-Timeframe Alignment Points Lower 📉
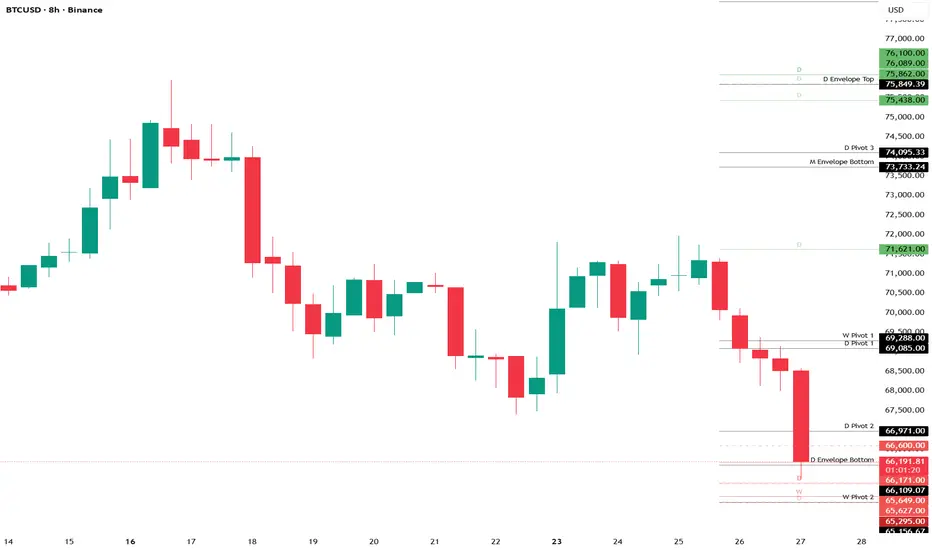
Ethereum is presenting one of the cleaner high-probability bearish setups in recent months. The monthly, weekly, and daily frameworks are all leaning in the same direction — and the weight of evidence favors continued downside pressure with $1,758 as the primary structural target on the radar.
The Big Picture (Monthly)
March 2026 was flagged as the strongest monthly timing target — a turning point window — and conditions now suggest the opposite trend is in effect heading into May. One Monthly Bearish Reversal was elected from the August 2025 high, and no Monthly Bullish Reversals have been confirmed from the recent lows. That asymmetry matters. Seven of eight monthly momentum and trend indicators are aligned bearishly, and the stochastic stack (Blue below Yellow below Red) shows no signs of a recovery cross forming. A sustained close above $2,441 on a monthly basis would begin to challenge this view — but absent that, the structural bias leans heavily lower.
Medium-Term View (Weekly)
The weekly picture reinforces the monthly read. Nine Weekly Bearish Reversals have been elected since the February highs, with zero Weekly Bullish Reversals confirmed from the lows. The nearest weekly bullish trigger sits at $2,198 — a weekly close above that level would be the first signal that the structure is shifting, but we remain well below it. Timing models flag the week of March 30 as a final oscillation target within a choppy window, with the probability leaning toward sustained downside thereafter into the April 27 window — flagged as the strongest upcoming weekly target. A risk skew of 786% to the downside versus roughly 2% to the upside captures the asymmetry of this setup well.
Near-Term Picture (Daily)
Friday, March 27 was the strongest daily timing target — a window where a short-term inflection became more probable. After a sharp sell-off on March 26, a daily Bullish Reversal was elected, suggesting at least a tactical bounce attempt is possible. Energy models on the daily frame show a divergence (price making new lows while energy holds higher), which leans toward a near-term relief rally rather than an immediate flush. The intraday target zone for any bounce sits around $2,091–$2,120 — a four-source Fibonacci price cluster. A daily close back below $2,026 would increase the probability that the decline resumes without a meaningful recovery.
Key Levels to Watch 🎯
- $2,198 — first Weekly Bullish Reversal; a sustained weekly close above shifts the odds
- $2,091–$2,120 — near-term resistance cluster; bounce target zone
- $1,966 — next projected weekly support
- $1,758–$1,751 — primary structural downside target cluster (Monthly Bearish Reversals)
- $1,628–$1,591 — secondary bearish target below if $1,758 gives way
Timing Windows to Monitor ⏰
- March 30 — daily Directional Change; potential brief high or inflection before decline resumes
- April 27 — strongest upcoming weekly target; high-probability pivot window
- May 2026 — monthly opposite-trend target; broader turning point zone
Bottom Line
The convergence of monthly, weekly, and daily signals creates a high-probability bearish scenario for Ethereum over the coming weeks. Any near-term bounce toward $2,091–$2,120 would likely represent a higher-probability entry for those aligned with the medium-term trend rather than a structural reversal. The setup favors downside continuation toward the $1,758 structural target — but a sustained weekly close above $2,198 would meaningfully shift the odds and would warrant reassessing this view entirely. 🐻
Three-Timeframe Alignment Points Lower 📉
Ethereum is presenting one of the cleaner high-probability bearish setups in recent months. The monthly, weekly, and daily frameworks are all leaning in the same direction — and the weight of evidence favors continued downside pressure with $1,758 as the primary structural target on the radar.
The Big Picture (Monthly)
March 2026 was flagged as the strongest monthly timing target — a turning point window — and conditions now suggest the opposite trend is in effect heading into May. One Monthly Bearish Reversal was elected from the August 2025 high, and no Monthly Bullish Reversals have been confirmed from the recent lows. That asymmetry matters. Seven of eight monthly momentum and trend indicators are aligned bearishly, and the stochastic stack (Blue below Yellow below Red) shows no signs of a recovery cross forming. A sustained close above $2,441 on a monthly basis would begin to challenge this view — but absent that, the structural bias leans heavily lower.
Medium-Term View (Weekly)
The weekly picture reinforces the monthly read. Nine Weekly Bearish Reversals have been elected since the February highs, with zero Weekly Bullish Reversals confirmed from the lows. The nearest weekly bullish trigger sits at $2,198 — a weekly close above that level would be the first signal that the structure is shifting, but we remain well below it. Timing models flag the week of March 30 as a final oscillation target within a choppy window, with the probability leaning toward sustained downside thereafter into the April 27 window — flagged as the strongest upcoming weekly target. A risk skew of 786% to the downside versus roughly 2% to the upside captures the asymmetry of this setup well.
Near-Term Picture (Daily)
Friday, March 27 was the strongest daily timing target — a window where a short-term inflection became more probable. After a sharp sell-off on March 26, a daily Bullish Reversal was elected, suggesting at least a tactical bounce attempt is possible. Energy models on the daily frame show a divergence (price making new lows while energy holds higher), which leans toward a near-term relief rally rather than an immediate flush. The intraday target zone for any bounce sits around $2,091–$2,120 — a four-source Fibonacci price cluster. A daily close back below $2,026 would increase the probability that the decline resumes without a meaningful recovery.
Key Levels to Watch 🎯
- $2,198 — first Weekly Bullish Reversal; a sustained weekly close above shifts the odds
- $2,091–$2,120 — near-term resistance cluster; bounce target zone
- $1,966 — next projected weekly support
- $1,758–$1,751 — primary structural downside target cluster (Monthly Bearish Reversals)
- $1,628–$1,591 — secondary bearish target below if $1,758 gives way
Timing Windows to Monitor ⏰
- March 30 — daily Directional Change; potential brief high or inflection before decline resumes
- April 27 — strongest upcoming weekly target; high-probability pivot window
- May 2026 — monthly opposite-trend target; broader turning point zone
Bottom Line
The convergence of monthly, weekly, and daily signals creates a high-probability bearish scenario for Ethereum over the coming weeks. Any near-term bounce toward $2,091–$2,120 would likely represent a higher-probability entry for those aligned with the medium-term trend rather than a structural reversal. The setup favors downside continuation toward the $1,758 structural target — but a sustained weekly close above $2,198 would meaningfully shift the odds and would warrant reassessing this view entirely. 🐻

Wyłączenie odpowiedzialności
Informacje i publikacje nie stanowią i nie powinny być traktowane jako porady finansowe, inwestycyjne, tradingowe ani jakiekolwiek inne rekomendacje dostarczane lub zatwierdzone przez TradingView. Więcej informacji znajduje się w Warunkach użytkowania.
Wyłączenie odpowiedzialności
Informacje i publikacje nie stanowią i nie powinny być traktowane jako porady finansowe, inwestycyjne, tradingowe ani jakiekolwiek inne rekomendacje dostarczane lub zatwierdzone przez TradingView. Więcej informacji znajduje się w Warunkach użytkowania.