
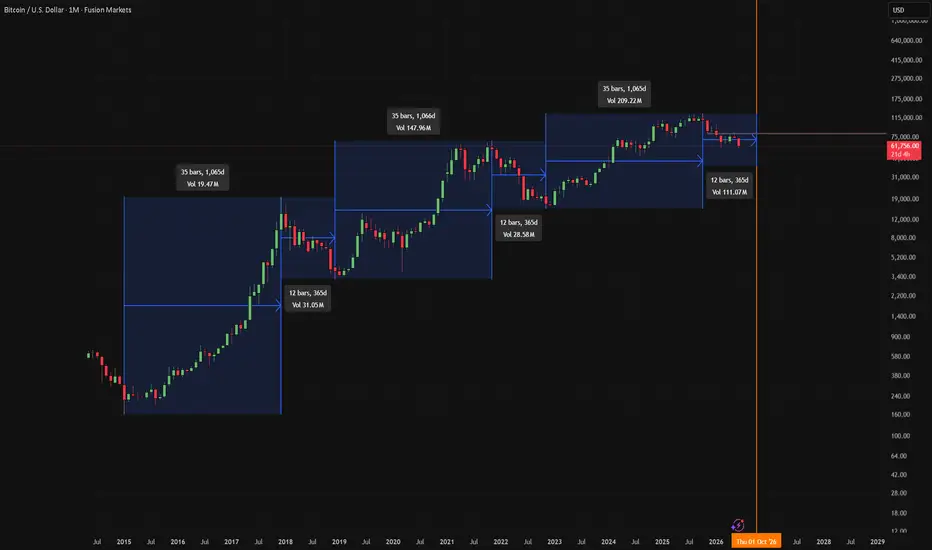
Bitcoin has followed a remarkably consistent pattern across multiple market cycles.
Looking at the chart, each cycle can be divided into two major phases:
🔹 Accumulation & Expansion (≈1,065 days)
After a major bear market bottom, BTC spends roughly 3 years building value and pushing into a new all-time high.
🔹 Distribution & Correction (≈365 days)
Following the euphoric phase, Bitcoin enters a period of distribution, volatility, and deeper retracements before the next cycle begins.
What stands out is the similarity in timing:
• Cycle 1: ~1,065 days up → ~365 days down
• Cycle 2: ~1,066 days up → ~365 days down
• Cycle 3: ~1,065 days up → currently approaching the historical distribution window
If this structure continues, the current market may be entering the late stage of the cycle where upside becomes more limited while downside risk increases.
This does not mean Bitcoin must crash immediately. Markets rarely move in perfect symmetry. However, historical cycle behavior suggests traders should pay close attention to signs of weakening momentum, lower highs, and increased distribution activity.
Key levels to watch:
Previous cycle highs acting as support
Long-term trendline structure
Volume behavior during rallies
Macro liquidity conditions
The orange vertical line marks the approximate point where previous cycles transitioned into a major correction phase.
Will this cycle break the pattern, or is history about to rhyme once again?
Not financial advice. Manage risk accordingly. 📈📉
Looking at the chart, each cycle can be divided into two major phases:
🔹 Accumulation & Expansion (≈1,065 days)
After a major bear market bottom, BTC spends roughly 3 years building value and pushing into a new all-time high.
🔹 Distribution & Correction (≈365 days)
Following the euphoric phase, Bitcoin enters a period of distribution, volatility, and deeper retracements before the next cycle begins.
What stands out is the similarity in timing:
• Cycle 1: ~1,065 days up → ~365 days down
• Cycle 2: ~1,066 days up → ~365 days down
• Cycle 3: ~1,065 days up → currently approaching the historical distribution window
If this structure continues, the current market may be entering the late stage of the cycle where upside becomes more limited while downside risk increases.
This does not mean Bitcoin must crash immediately. Markets rarely move in perfect symmetry. However, historical cycle behavior suggests traders should pay close attention to signs of weakening momentum, lower highs, and increased distribution activity.
Key levels to watch:
Previous cycle highs acting as support
Long-term trendline structure
Volume behavior during rallies
Macro liquidity conditions
The orange vertical line marks the approximate point where previous cycles transitioned into a major correction phase.
Will this cycle break the pattern, or is history about to rhyme once again?
Not financial advice. Manage risk accordingly. 📈📉

Wyłączenie odpowiedzialności
Informacje i publikacje nie stanowią i nie powinny być traktowane jako porady finansowe, inwestycyjne, tradingowe ani jakiekolwiek inne rekomendacje dostarczane lub zatwierdzone przez TradingView. Więcej informacji znajduje się w Warunkach użytkowania.
Wyłączenie odpowiedzialności
Informacje i publikacje nie stanowią i nie powinny być traktowane jako porady finansowe, inwestycyjne, tradingowe ani jakiekolwiek inne rekomendacje dostarczane lub zatwierdzone przez TradingView. Więcej informacji znajduje się w Warunkach użytkowania.